Written by: Choon Kiat William Chia
Analysis for the IPP
The three analyses listed below were conducted using DNV GL GeniE to enable the team to comprehensively understand the structural behaviour and responses of the IPP when subjected to design conditions as detailed under the webpage of Design Basis of the IPP.
- Linear static analysis with environmental loads
- API code checks for tubular members
- Eigenvalue analysis
The whole design and analysis procedure follows that as shown in Figure 1. The analyses was conducted without consideration of jacket joints as well as piles due to time constraints. The linear static analysis with environmental loads was conducted to determine the relevant forces, moments and stresses on the tubular members due to self-weight of the structure as well as environmental forces. This in turn allows the design of individual tubular members to be validated using API RP-2A-WSD. If any of the tubular member fails the code check, its diameter/thickness would first be modified and code checked again before the structural details was changed through addition and/or reposition of bracing. On the other hand, eigenvalue analysis will allow the mode shapes of the structure to be determined. Lastly, it is noted that only the analysis results for the final design iteration as of the creation of this website would be presented here.
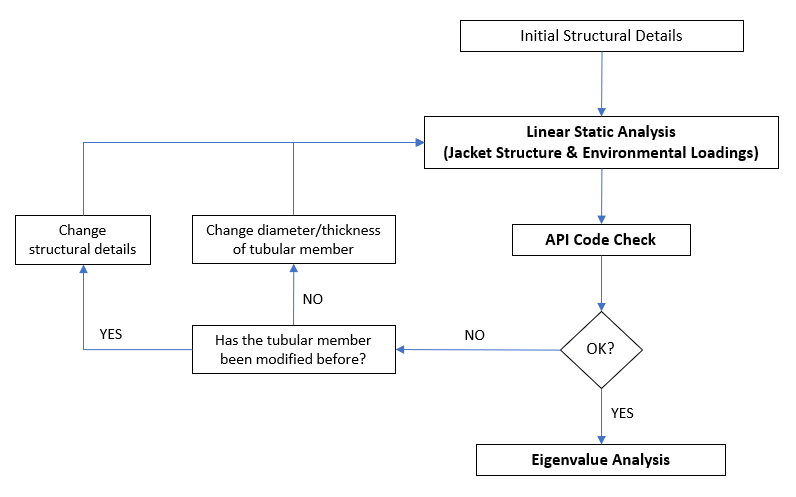
Figure 1: Flowchart for the analysis procedure.
Structure Modelling
The structure was modelled in GeniE using straight beams (pipes) of different diameters and thicknesses. The model was then meshed using the inbuilt automatic meshing function, yielding a total of 1005 elements and 737 nodes. Figure 2 below shows the modelled structure and its boundary conditions. The pile boundary condition was set to fixed and the bottom ends of the legs were constrained in all directions to simulate fixed supports (circled in red in Figure 2). Further details of the modelling can be found in Structural Arrangement Drawings for the Jacket and SESAM Modelling Details .
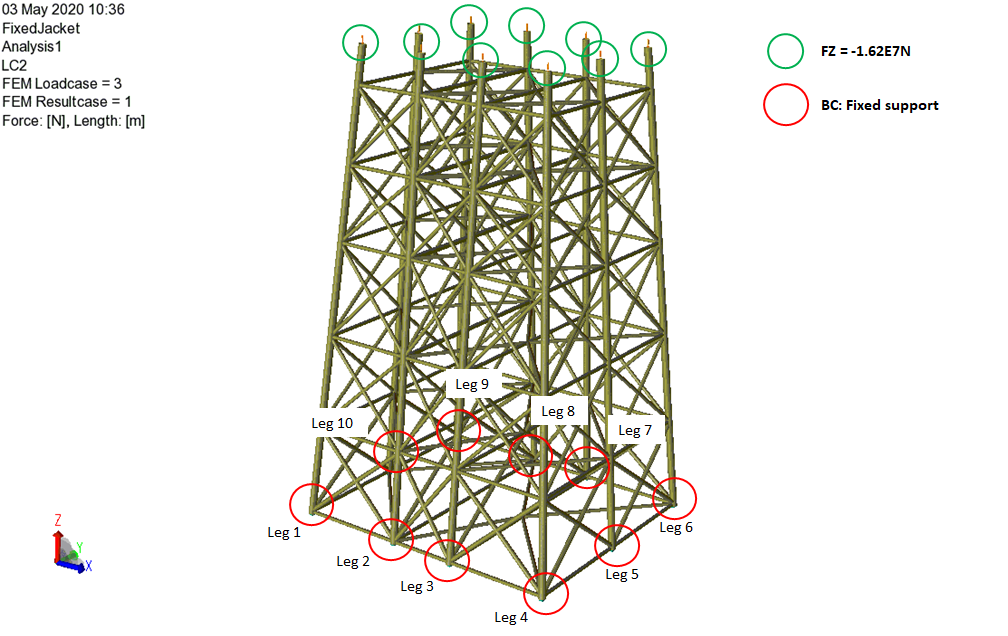
Figure 2: Modelled jacket structure and its boundary conditions.
On the other hand, to simulate the load induced by the 16500 tonnes topside, the top end of each of the leg was subjected to a 16.2 MN force in the negative z-direction (circled in green in Figure 2). This is assuming that the topside load would been shared equally by the ten jacket legs. In addition to that, environmental loads induced by the wind, current and wave conditions as specified in Design Basis of the IPP were applied to the structure from 0° to 360° headings at 45° interval. This fulfills the minimum requirement of API (2002) where a symmetrical rectangular platform has to be analysed for a minimum of eight directions. The headings are measured counterclockwise from the x-axis as shown in Figure 2 where 0° is in positive x-direction, 90° is in positive y-direction, 180° is in negative x-direction and 270° is in negative y-direction.
Linear Static Analysis
Table 1 below shows the results for the linear static analysis and the detailed results for each heading can be downloaded by clicking on the respective links. From Table 1, it can be seen that the maximum nodal displacement occurred when the heading is 315° while the maximum beam displacement occurred when the heading is 0°. This is in contrast with the maximum Von Mises stress as it stayed relatively constant for all headings at 2.2×10⁸ Pa. On the other hand, the utilisation factor (Utotal) is the highest when the environmental headings are 135° and 315° at 0.84.
Table 1: Results for linear static analysis for the different environmental loads headings.
| Headings (°) | Maximum Nodal Displacement, all (m) | Maximum Beam Deflection (m) | Maximum Von Mises (Pa) | Max Utotal | Detailed Results |
| 0 | 0.179 | 0.127 | 2.221E8 | 0.74 | Detailed Results for 0° |
| 45 | 0.163 | 0.102 | 2.222E8 | 0.74 | Detailed Results for 45° |
| 90 | 0.143 | 0.0833 | 2.221E8 | 0.74 | Detailed Results for 90° |
| 135 | 0.177 | 0.0906 | 2.219E8 | 0.84 | Detailed Results for 135° |
| 180 | 0.171 | 0.112 | 2.217E8 | 0.74 | Detailed Results for 180° |
| 225 | 0.151 | 0.0910 | 2.216E8 | 0.74 | Detailed Results for 225° |
| 270 | 0.141 | 0.0864 | 2.217E8 | 0.74 | Detailed Results for 270° |
| 315 | 0.181 | 0.0891 | 2.219E8 | 0.84 | Detailed Results for 315° |
It is worth noting that regardless of the heading for environmental loads, the maximum nodal displacement would always occur at the top end of a corresponding jacket leg. For example, as seen from Figure 3, the top end of Leg 9 experienced the largest nodal displacement of 0.181 m when the environmental loads heading is 315°.
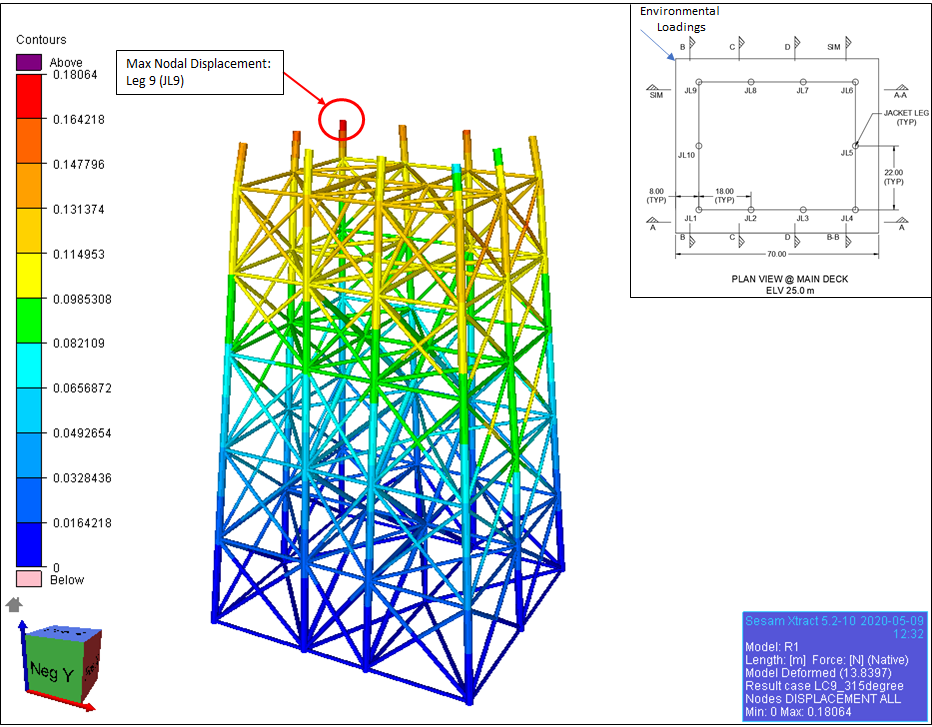
Figure 3: Nodal displacement of the model (all) for 315° environmental loads.
On the other hand, Figure 4 below shows the worst total utilisation factor for each tubular member for all environmental load headings. From the result, it can be seen that only the bottom ends of Leg 4 and Leg 9 experienced total utilisation factors that were above 0.8 when the environmental headings were 315° and 135° respectively. On the other hand, other tubular members experienced utilisation factors that were below 0.8 for all environmental load headings. As a result, it can be said that the structure can be further optimised to save cost and weight as the utilisation factors for the majority of the tubular members remained low. Additionally, a more precise modelling of the topside would be required in order to obtain a more accurate result as well.
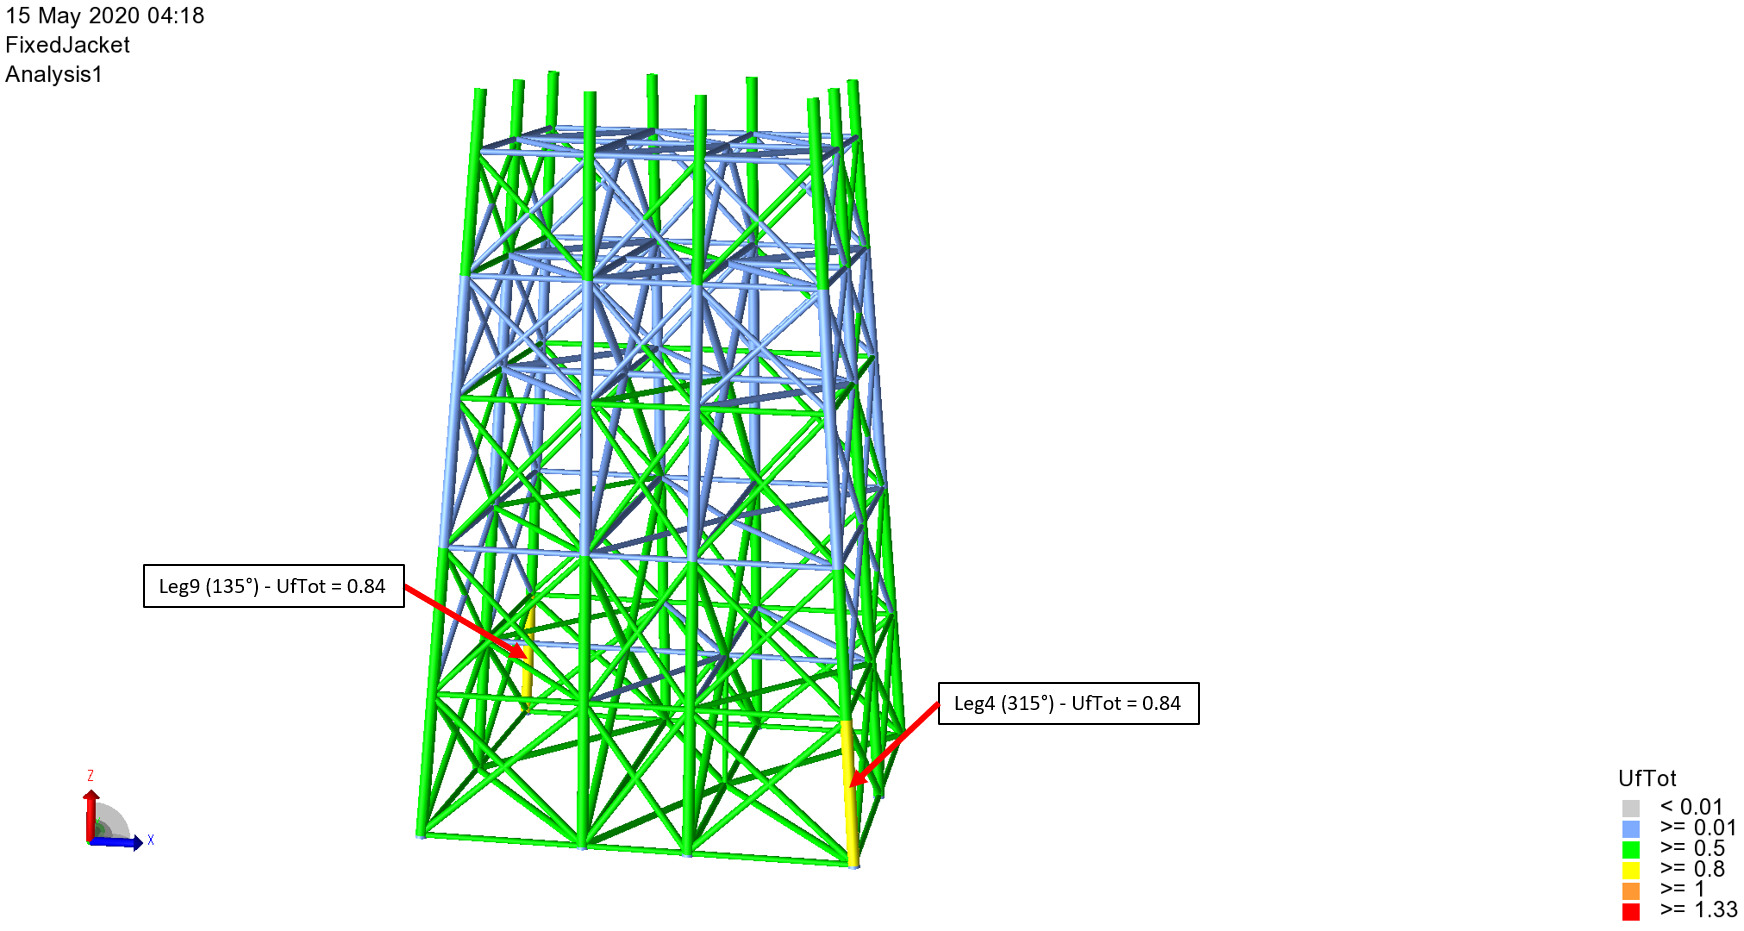
Figure 4: Worst utilisation factor for each tubular member for all environmental headings.
Eigenvalue Analysis
Using DNV GL GeniE, eigenvalue analysis was conducted on the modelled structure and Table 2 shows the results of the first ten mode shapes . From the table, it can be seen that the fundamental frequency of the jacket structure is approximately 1.53 Hz which is far apart from the typical North Sea storm wave frequencies of 0.05 to 0.06 Hz. As a result, it can be said that the designed jacket structure would not experience resonance due to wave excitation. However, to obtain a more accurate result, the topside would have to be better represented
Table 2: Eigenvalue analysis results.
| No. | Eigen Period (s) | Eigen Frequency (Hz) | Displacement, All (m) |
| 1 | 0.65 | 1.53 | 4.95E-3 |
| 2 | 0.52 | 1.94 | 6.34E-4 |
| 3 | 0.44 | 2.28 | 6.92E-4 |
| 4 | 0.41 | 2.46 | 3.63E-3 |
| 5 | 0.36 | 2.78 | 2.85E-3 |
| 6 | 0.32 | 3.11 | 8.58E-4 |
| 7 | 0.29 | 3.49 | 9.14E-4 |
| 8 | 0.28 | 3.62 | 2.75E-2 |
| 9 | 0.28 | 3.63 | 4.97E-2 |
| 10 | 0.27 | 3.71 | 2.90E-3 |
The first ten mode shapes for the jacket structure are as shown in Figure 5 below.
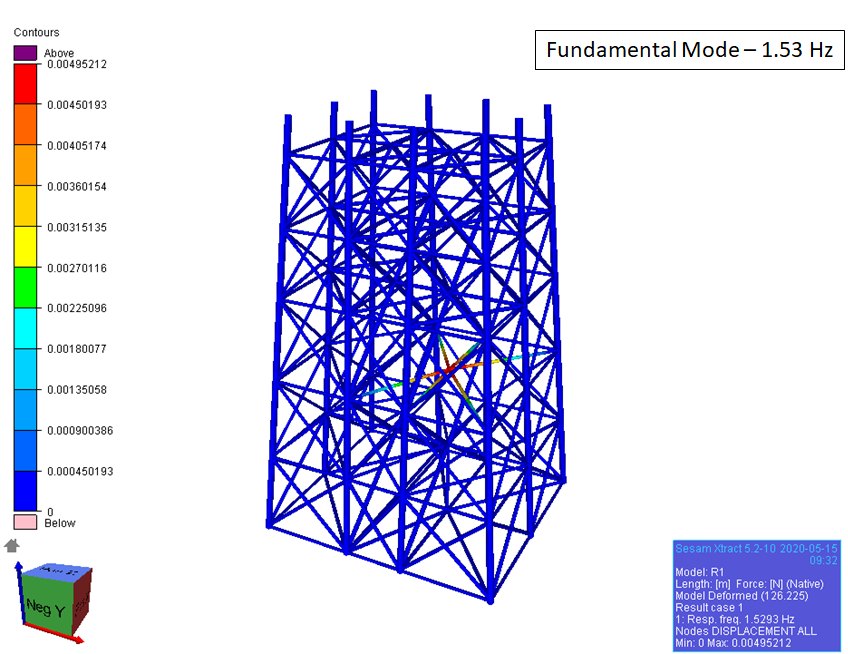
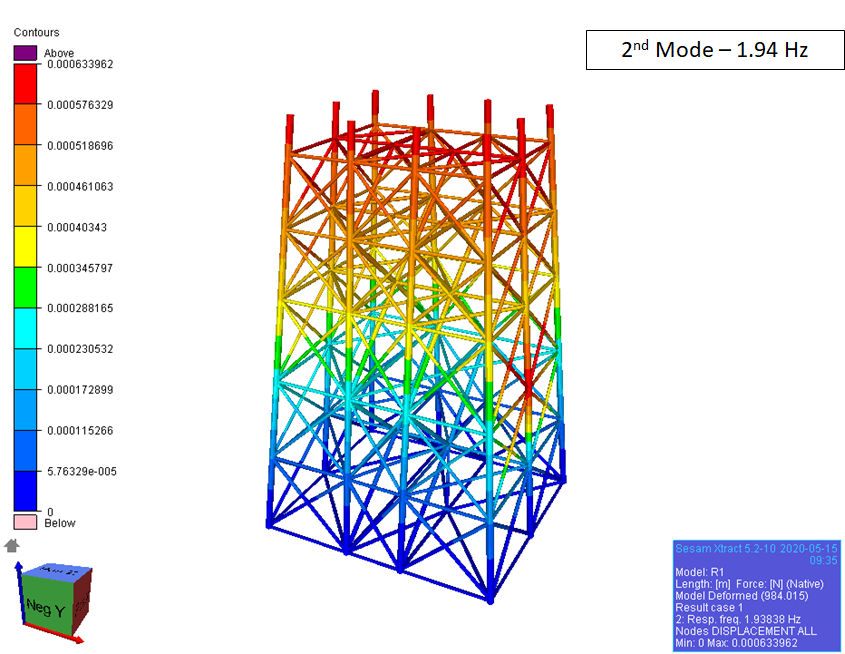
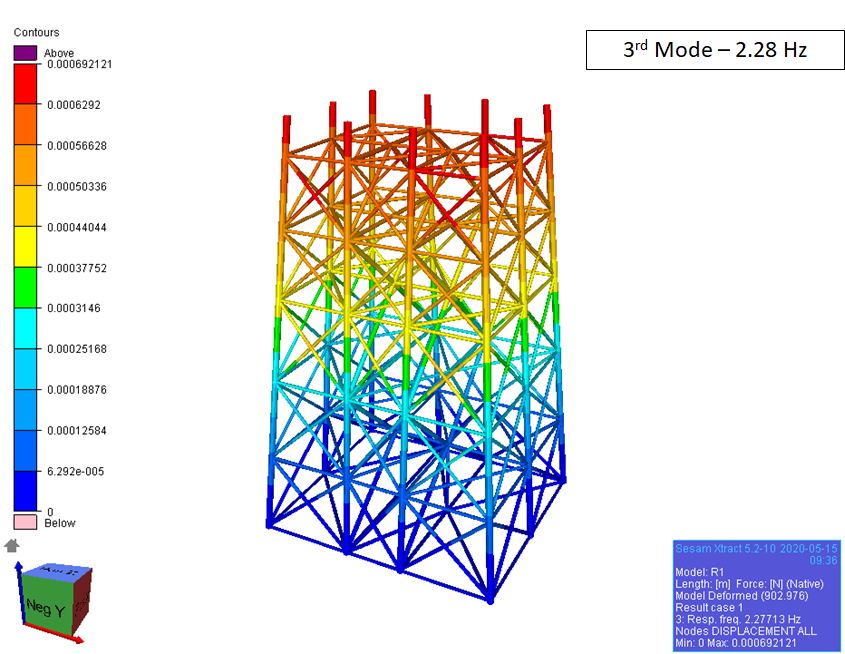
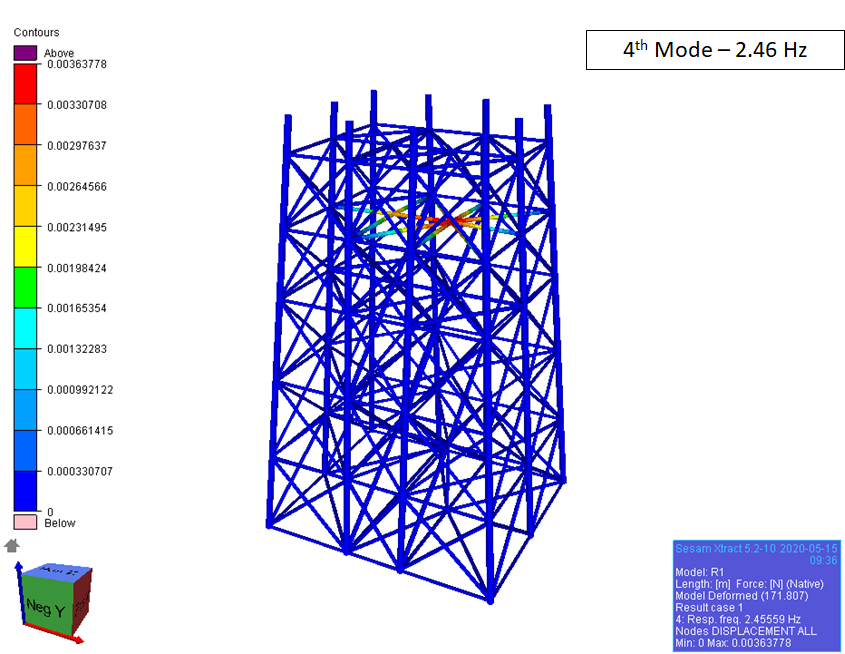
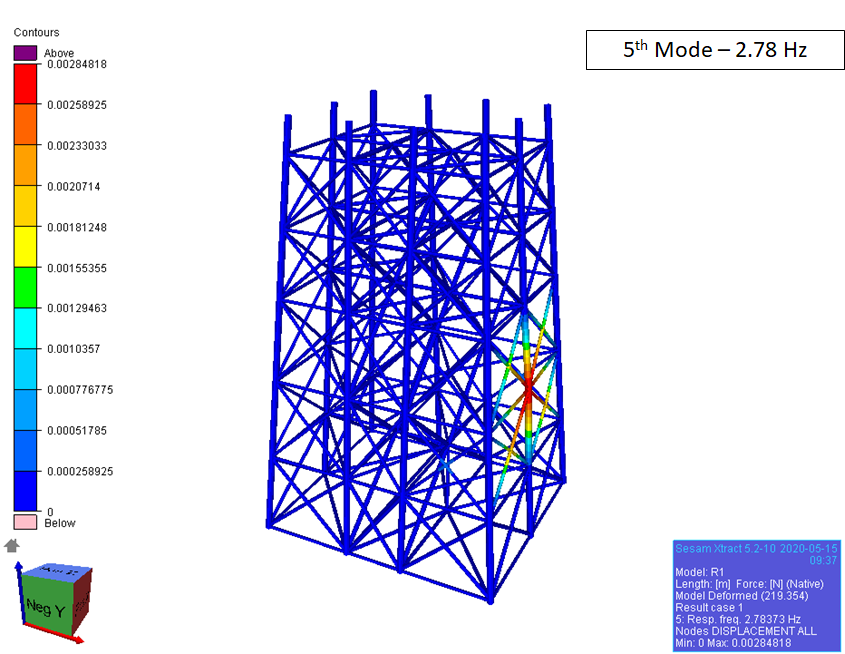
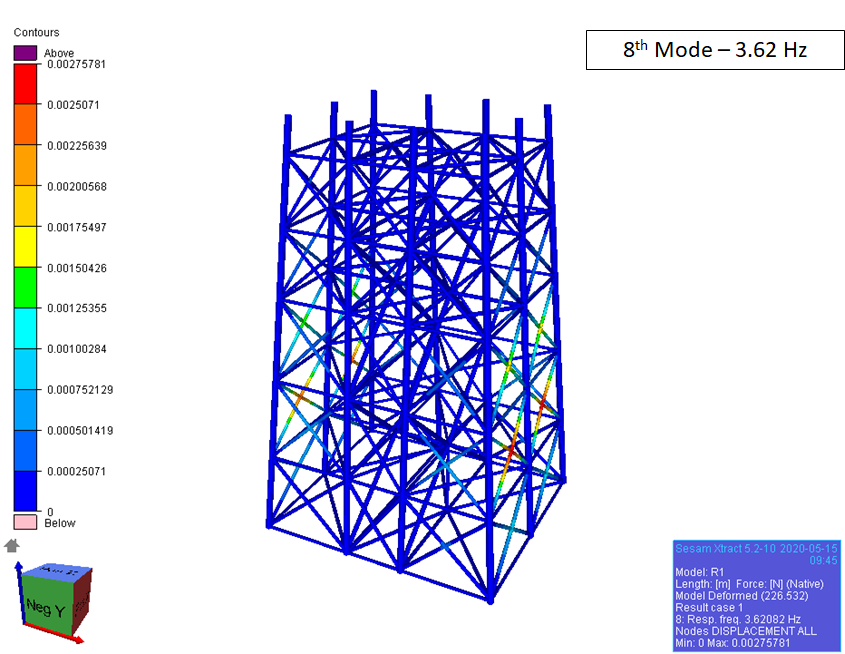
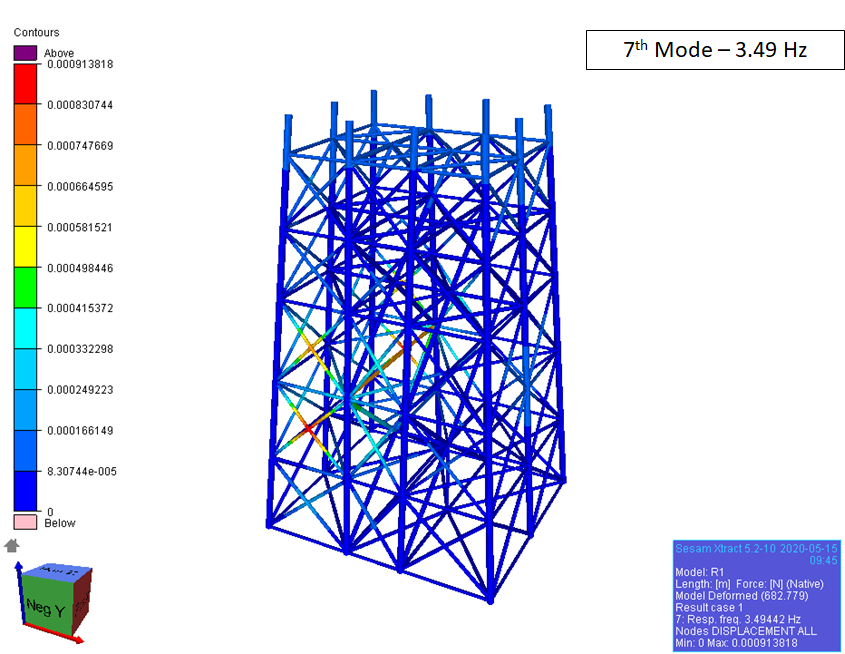
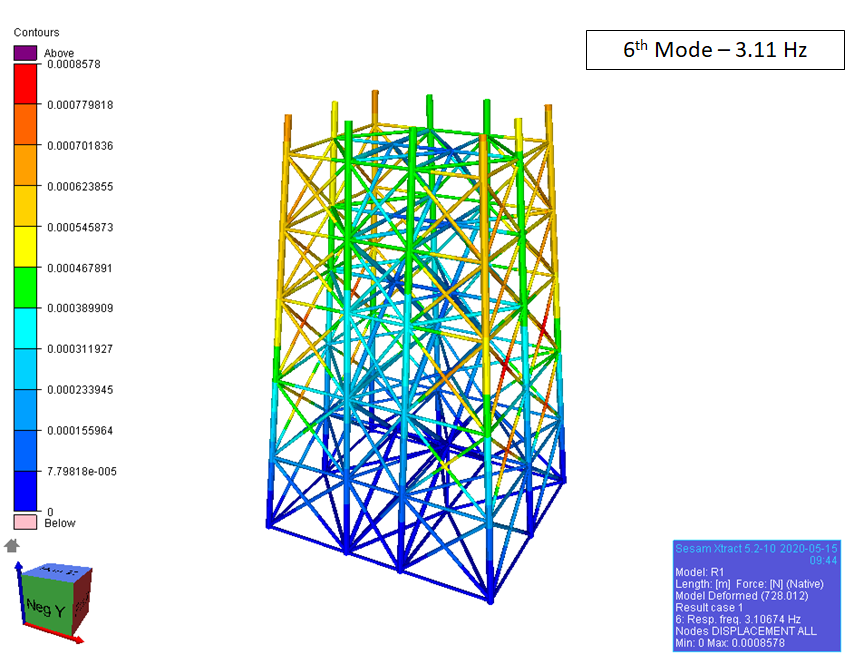

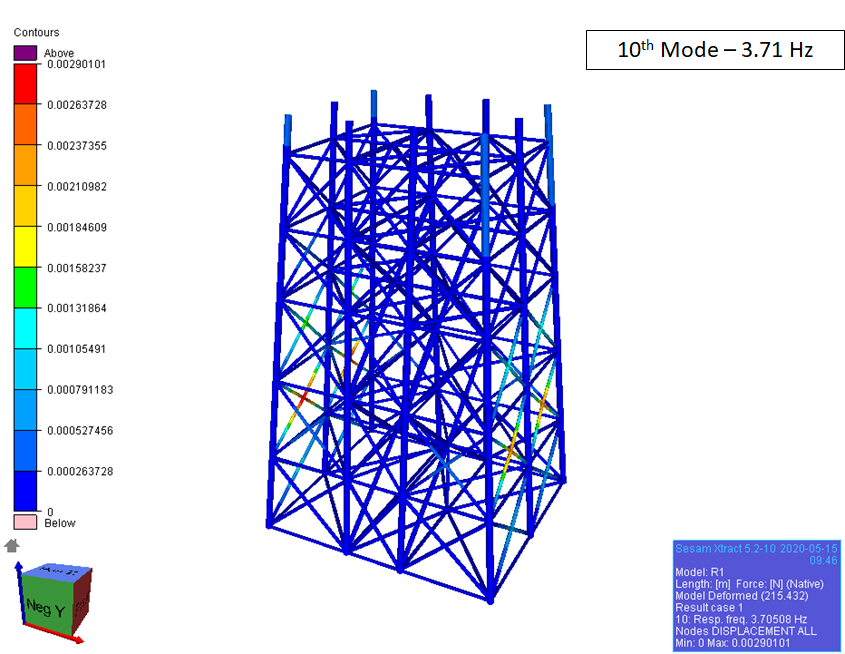
Figure 5: First ten mode shapes extracted from the eigenvalue analysis (click on individual figures for clearer images).
Conclusion & Future Recommendations for Design of IPP
The design analysis included a number of simplifications and assumptions that could be better refined to allow the design of the IPP to be more accurate and realistic. Firstly, the various onboard systems including storage system for the hydrogen produced, etc. could be better defined (ie to work out the weight, footprints etc.) to allow the topside arrangement to be clearer. In contrast to the current approach that just assumed the total topside load to be 16500 tonnes and that it would be supported equally by the ten jacket legs, a better defined topside would allow the topside load to be better estimated and modelled in GeniE. This in turn would allow the design to be much more accurate and refined. Similarly, jacket joints and piles would have to be considered in future analysis as tubular connections as well as pile soil interaction are important factors to be considered in fixed jacket design as well. Besides, the structure would also need to be subjected to dynamic analysis to allow a much better understanding of the structural behaviour and responses. Lastly, fatigue analysis would also need to be conducted to investigate the behaviour of the structure when subjected to cyclic loads.
That being said, the current iteration of jacket design still served as a good starting point for further optimisation and refinement as apart from two tubular members, all other members have relatively low values of total utilisation factor.