Written by: Luca Grispiani
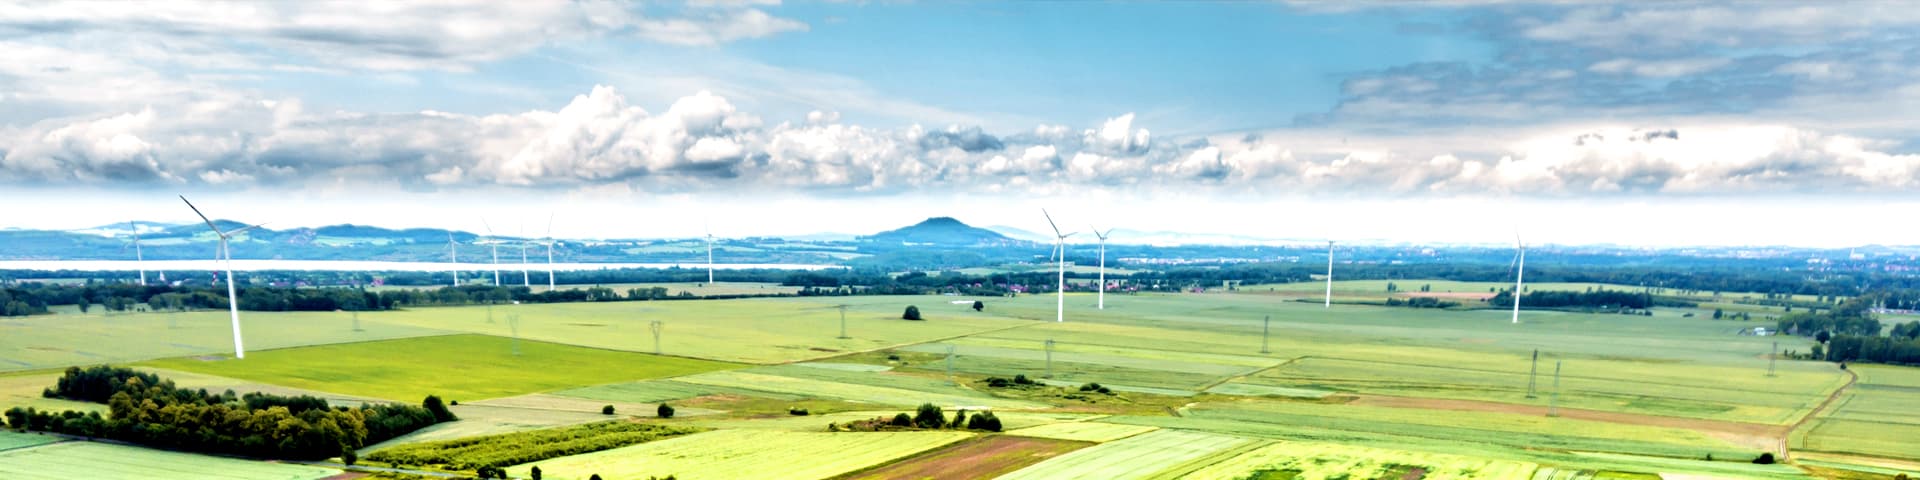
Wind Farm Power Output
The annual wind speed distribution is described by a Weibull distribution., as explained here. Therefore, knowing the probability of occurrence of each wind speed, it is possible to convert the Cumulative Probability Function into a fraction of days, in relation to the total number of days in a year. This calculation results in the following chart, showing the relationship between the wind speed characteristics of the wind turbine and Cumulative Wind Speed Distribution.
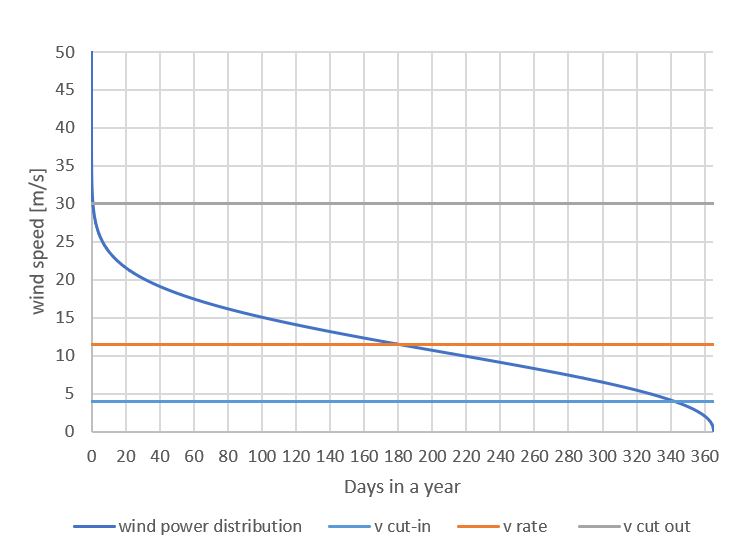
Figure : Cumulative Wind Speed Distribution.
The Annual Energy Yield of single turbine is calculated as the sum of each power generation from each wind speed state. Mathematically, this is expressed as:
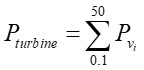
Therefore, the result outcomes as 59,37 GW*h/typical year, with a capacity factor equal to 67,7%.
The Wind Park Power Output is calculated as the multiplication of the power output from a single wind turbine times the number of the turbines, but also considering a number of energy losses, such as the wake effect or the electrical array interconnection.
| Unit turbine Power Output | 59.37 | GW*h/year |
| Capacity Factor Unit Turbine | 67.8 | % |
| Number of Turbines | 100 | |
| Wake Turbolence energy losses in the Wind Farm | 7 | % |
| Electrical Array in energy losses in the Wind Farm | 3 | % |
| Other losses | 2 | % |
| Power Generation Wind Farm | 5248.44 | GW*h/year |
| Capacity Factor Wind Farm | 59.91 | % |
As a result, the Power Output for the whole Wind Park is equal to 5’248.44 GW*h/year., with an overall efficiency of 59.9%., directly transferred to the Integrated Production Platform for the Hydrogen Production Process.
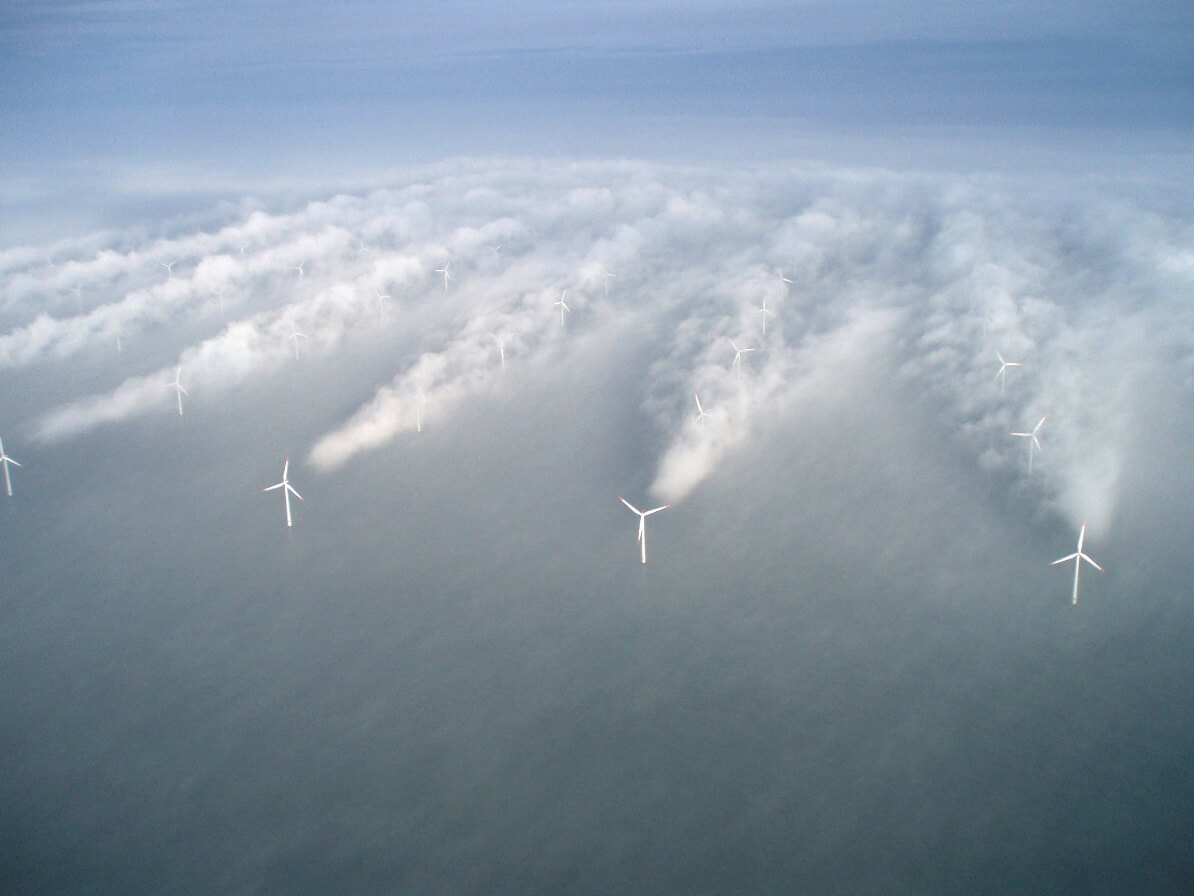
Figure : Wake Turbulence (Vattenfall Wind Farm, Denmark)
References:
Wind Energy Engineering, Trevor M. Letcher, 2017, Elsevier, ISBN: 978-0-12-809451-8