
Written by: Raul Rogerio Pimentel Ribeiro
After defining all aspects of hydrogen production, the overall energy demand for producing it can be calculated to deliver, among other information, the overall efficiency of the system. The result of this final view also influences the final cost of energy and, hence, the feasibility of the project. Before it, figure 1 sketches a simple overview of the system as a total.
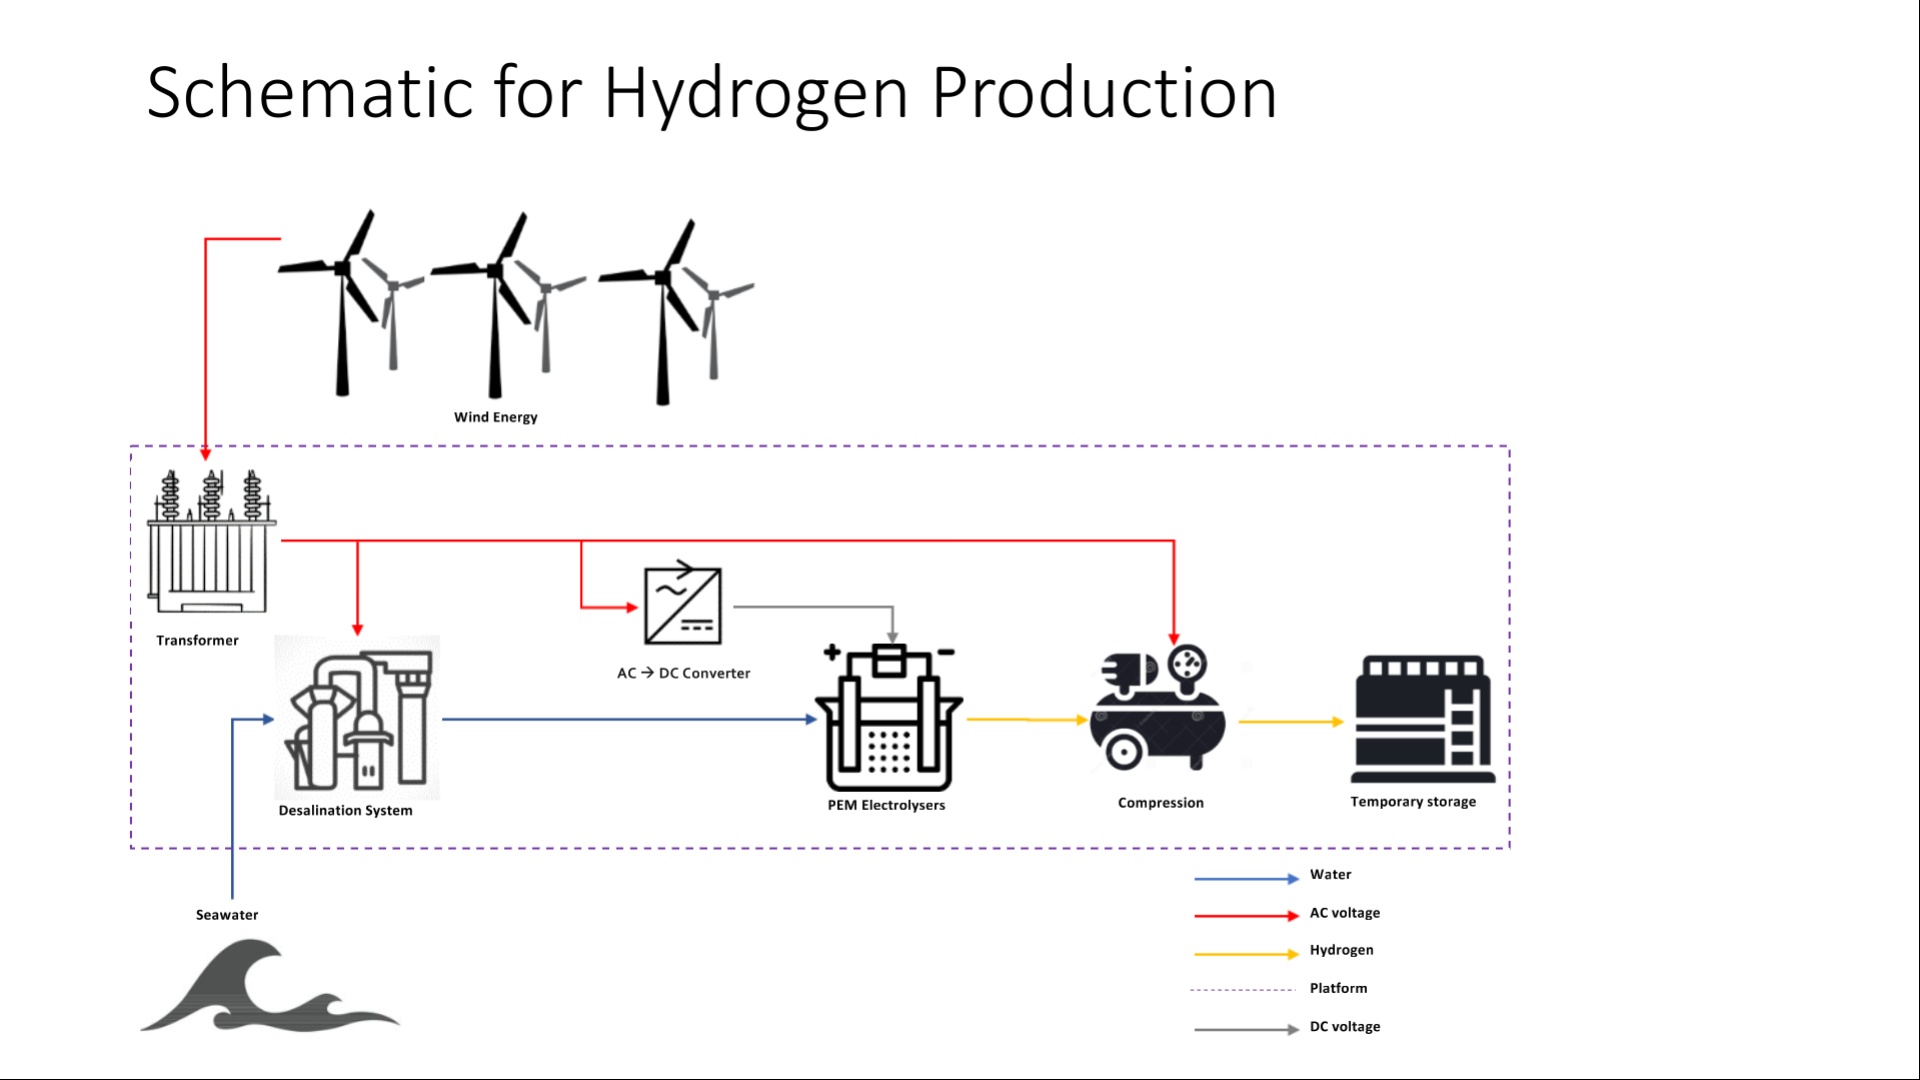
Figure 1: Overall Integrated Processing Platform (IPP) System Design
The block diagram outlined in figure 2 represents the energy flow of the hydrogen production. It is important to emphasise that the block diagram shows the main energy demands, ignoring minor systems such as electronic systems, operation system, and illumination system. Also, the platform will perform fully automatically (without a crew on board). It means a reduction in secondary energy demand such as accommodation, food, refrigeration, and so on. Thus, these minor demands are not considered.
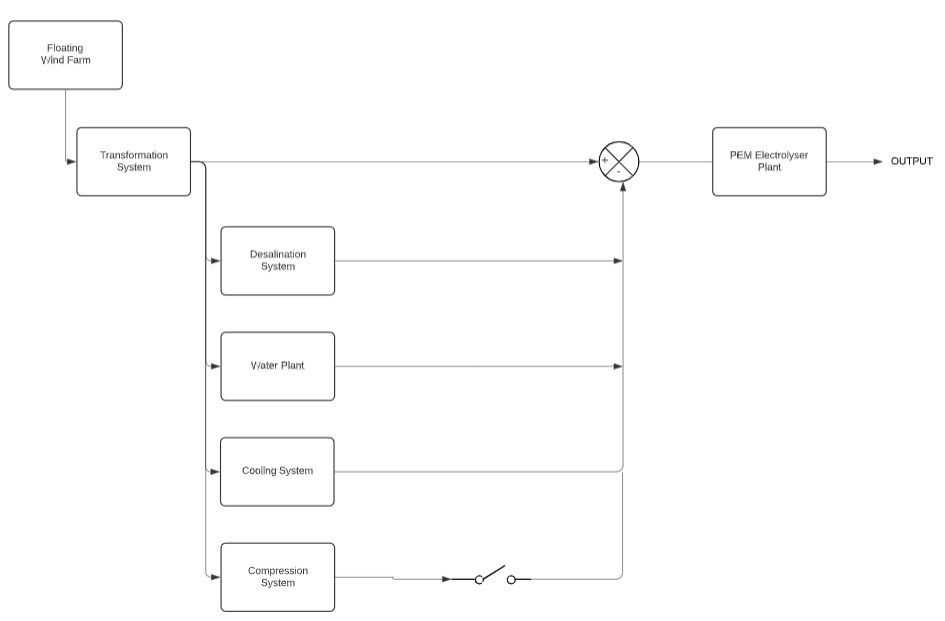
Figure 2: Block diagram of the energy flow for the IPP system
The illustrated switch in figure 2 represents the possibility of choice between storing or directly transporting the final product. It is due to the fluctuation of market demand which does not provide a flat energy demand profile.
The overall energy consumption is exposed in table 1. This table includes the energy demand of all previously cited components and the perspective of hydrogen production both in absolute values and the percentage of the total energy available.
Table 1: Energy Consumption of IPP systems
The energy profile consists of the total energy input, the total losses, and, hence, the overall efficiency of the IPP plant as expressed to table 2.
Table 2: Energy profile of IPP plant
As it is defined above, the overall efficiency of the system remains roughly the same. The efficiency of the system is related to both efficiencies of hydrogen production and the energy consumption of all secondary systems of the platform. The energy distribution is expressed graphically (figure 3) to illustrate better the portion of energy demand for each secondary system.
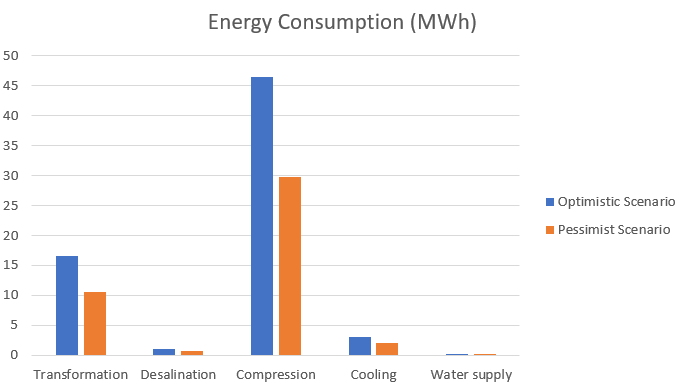
Figure 3: Energy demand for secondary systems
As illustrated, the transformation and compression systems are responsible for the highest amounts of energy in the system. The total energy demand, overall losses, and total energy transformed into hydrogen are shown in figure 4.
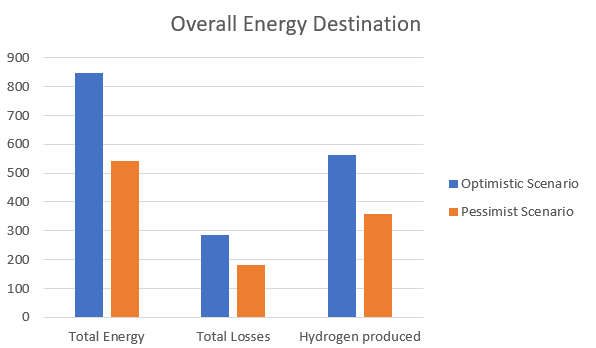
Figure 4: Overall energy destination of the IPP
The overall energy distribution in both scenarios describes the same efficiency regardless of the final production of the IPP. Figure 5 illustrates the final destination for each portion of energy coming from the wind farm and the efficiency of the system.
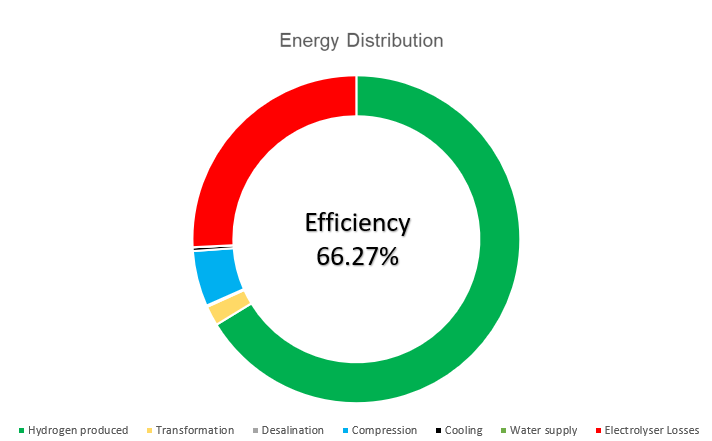
Figure 5: Energy distribution and overall efficiency
Impacts of Green Hydrogen
As previously stated, green hydrogen has zero carbon emissions. This quality collaborates with the decrease of climate changes and the intensification of the greenhouse effect (EPA, 2019). Although this topic is always discussed, the dimension of carbon emission and carbon saving is still abstract concepts. The United States Environmental Protection (EPA) (2019) has developed a comparison between the energy produced and the gas emission savings in practical and concrete terms such as emissions from power plants, vehicles, and electronic devices that helps the understanding of this topic. At this stage, the comparison states the optimistic nominal hydrogen production within one hour and 1 kilogram of hydrogen with an energy capacity equal to 36 kilowatt-hours. Based on these assumptions, the table 3 below shows the greenhouse gas emissions from 561.6MWh which is equivalent to 438 tons of carbon dioxide (CO2).
Table 3: Greenhouse gas emissions in CO2 equivalent