Using the UK Government's historical data was essential for modelling our different future scenarios for our project. We had to understand previous trends in various car fuel-types at a national scale, so we could then apply it to some of the future predictions the team made.
As you can see from the figure 1 below, petrol and diesel cars have remained the most popular choice of private transportation for more than 20 years, with diesel recently becoming more popular. This is due to many reasons, one of which is that diesel engines can achieve higher efficiencies due to their higher compression ratio of fuel/air mix to that of their petrol engine counterparts.
As you can see from the figure 1 below, petrol and diesel cars have remained the most popular choice of private transportation for more than 20 years, with diesel recently becoming more popular. This is due to many reasons, one of which is that diesel engines can achieve higher efficiencies due to their higher compression ratio of fuel/air mix to that of their petrol engine counterparts.

Figure 1: Great Britain Registered Vehicles 1994-2017
It can also be seen that hybrid electric and electric cars can hardly be seen on this graph at all as there are so few previously and currently registered on UK roads. This will all have to change if the Government's internal combustion car ban in 2040 is carried through.
Another aspect of data we had to analyse for our project was that of the miles cars were covering annually. This was so that the same data could be applied to EVs if they are being introduced at a national level. The Government only provided data from England, not Great Britain, however it was assumed that the data from vehicles in England in alone would give the team an accurate enough representation to what most 4-wheeled cars are travelling in a year.
Another aspect of data we had to analyse for our project was that of the miles cars were covering annually. This was so that the same data could be applied to EVs if they are being introduced at a national level. The Government only provided data from England, not Great Britain, however it was assumed that the data from vehicles in England in alone would give the team an accurate enough representation to what most 4-wheeled cars are travelling in a year.
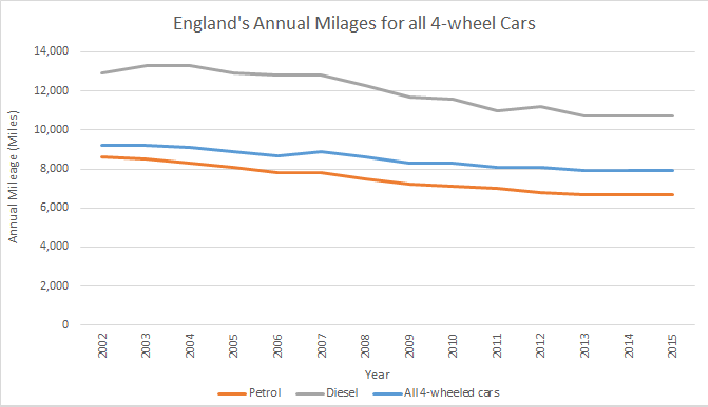
Figure 2: England's Annual Mileages for all 4-wheel Cars
From 2002, it can be seen that there has been a steady decline in the total average of miles covered by both petrol and diesel cars, which levels off at 2013/2014. The mileages for all 4-wheeled cars is much lower than the standard mean of the mileages covered by both petrol and diesel cars because it represents a relative mean value, ie there diesel cars travel longer distances with a year but there is far less diesel cars than there is petrol. This was the value that was then extrapolated and used for determining the mileages that would be covered by EV's and therefore the electrical energy requirements.
References

1. UK Government Statistical Data Set Table VEH0203
|

2. UK Government Statistical Data Set Table NTS0902
|