In this section the emissions of Carbon Dioxide from exhaust pipes are studied and how this could change for Great Britain as a whole by 2050 is modelled for each scenario. Currently the annual tailpipe emissions of Carbon Dioxide is 68 Million tonnes (1).
Modelling Technique
In order to model the emissions of a vehicle, firstly all cars were categorised into three different types; Internal Combustion Engines, Hybrids and Electric Vehicles. Emissions Values per vehicle for each type first had to be assigned.
For ICE, currently there is approximately a 50/50 split in Great Britain of Petrol to Diesel and so the values for and average of the petrol and diesel values were taken to provide the final ICE value. However as cars are evolving to emit less, a single value could not be used for 2016-2050. The data used in this case is emissions for new cars. Therefore with the ten year lifespan of cars in mind, the average emissions of cars on the road now was calculated as an average of the emissions of new cars and the emissions of new cars ten years ago (2). For example
Up to 2020, the 2007 value (165) and the current average of new sales (118) is used.
2020-2030, the 2010 value (144) and the 2020 limit by policy (95) is used.
2030 onwards 95g/km is used.
Note this relies on the ten year lifespan of vehicles
For hybrid vehicles, due to the large range of hybrid types, including diesel, petrol and plug-in, there is a very large range of CO2 emission values. However, in order to model the emissions effectively, one value must be used. Therefore, the value used was an average of the Euro 6(3) limit of 95g/km and the lowest g/km for hybrid cars currently. This gives a value which takes into account the fact that some vehicles meet, and indeed exceed the Euro 6 values, and that some hybrids are extremely low emission.
Below is a summary table of all the numbers used in this model. These are the emissions per vehicle.

Using these values the total emissions for each scenario can be used. The emissions per car was then multiplied by the number of that type of car. These numbers were taken from the spreadsheet. Firstly these numbers were added together to give the total emissions in g/km, and then divided by the total number of cars to give the average emissions a car in the UK.
However to give a more easily understood number, the total annual emissions Great Britain was calculated. To do this the total emissions in g/km was multiplied by the average annual mileage of a car. This gave a final value of the total annual Carbon Dioxide tailpipe emissions in 2050.
However to give a more easily understood number, the total annual emissions Great Britain was calculated. To do this the total emissions in g/km was multiplied by the average annual mileage of a car. This gave a final value of the total annual Carbon Dioxide tailpipe emissions in 2050.
Results
The results for the total volume of Carbon Dioxide tailpipe emissions in Great Britain in 2050 for the Business as Usual, the Conservative and the Aggressive scenario are outlined below. For the description of each scenario visit our scenario page here, and for the results for the other six scenarios, please visit our results page.
Business as Usual
For the business as usual scenario the total amount of Carbon Dioxide emitted from exhausts for all cars in Great Britain was calculated to be
48 Million tonnes
This is a slight reduction compared to the current emission, however the number is still relatively high. This is as there a large number of Internal Combustion Engines (ICE) in the market.
Conservative
For the conservative scenario the total amount of Carbon Dioxide emitted from exhausts for all cars in Great Britain was calculated to be
24 Million tonnes
The reduction in emissions for this scenario comes from the introduction of both EV and hybrid vehicles at a much higher market ratio than in the business as usual scenario. This results in a very low number of ICE by 2050. Therefore the 24Mt of emissions comes from the remaining ICE and the hybrid vehicles.
Aggressive
For the aggressive scenario the total amount of Carbon Dioxide emitted from exhausts for all cars in Great Britain was calculated to be
2 Million tonnes
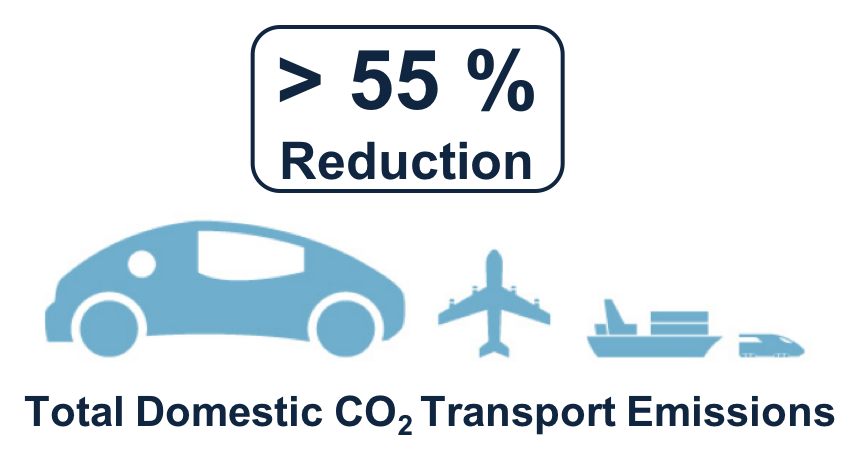
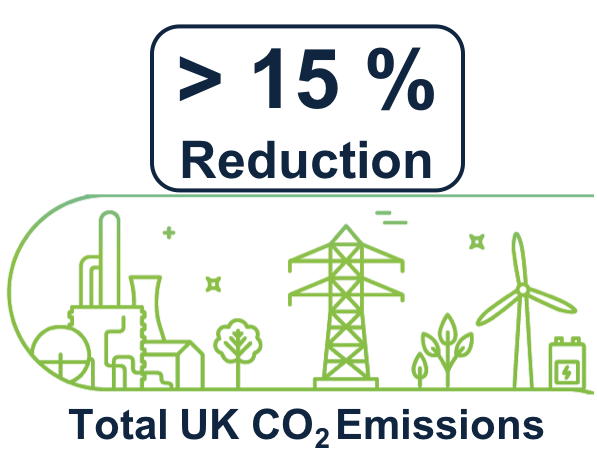
The aggressive scenario gives the biggest impact with regards to the domestic Carbon Dioxide emissions (4) and transport emissions (1) in the UK.
For the aggressive scenario the total amount of Carbon Dioxide emitted from exhausts for all cars in Great Britain was calculated to be
2 Million tonnes
The aggressive scenario gives the biggest impact with regards to the domestic Carbon Dioxide emissions (4) and transport emissions (1) in the UK.
This significant reduction in Carbon dioxide emissions are an extremely important consideration for the UK. The introduction of Electric Vehicles could significantly help countries to meet Carbon Dioxide reduction targets and important policy goals.
However an extremely important consideration with this model is that it only includes tailpipe emissions and not any emissions from how the electricity is produced. Therefore if the electricity is produced from a generation source that emits a large amount of Carbon Dioxide, then the reduction in tailpipe emissions will be offset. Therefore in order to see the benefits of the EV transition with regards to emissions, the generation of electricity in the UK, and any additional supply required to match the additional demand, would have to revised.
Further the emissions from the manufacture and transportation of the Electric Vehicle itself is not considered.
In the next section we will discuss the Nitrous Oxide tailpipe emissions.
REFERENCES

1.Transport Statistics Great Britain 2017
Department for Transport
pp 82
|

2. De Wilde, H. P. J. Kroon, P. (2013) Policy options to reduce passenger cars CO2 emissions after 2020, ECN
|
3.Regulation (EC) No 715/2007 of the European Parliament and of the Council
|

4.Carbon dioxide emissions by IPCC category
(IPCC - Intergovernmental Panel on Climate Change)
|