UK Electrical Power Demand
Our Business as Usual and Conservative scenarios have resulted in 1.4 and 4.3 millions electric cars on the road by 2050 respectively. We have calculated that in each of these scenarios, that the UK would only only require an extra 2.98TWh and 9.15TWh annually of electrical energy to sustain such transitions. Respective to UK annual electrical energy generation, this is would be a minute fraction of what we already produce in 2018. That being said, our most aggressive scenario involves a 100% market takeover by electric vehicles by 2050, therefore this scenerio out of our 9 scenarios has the largest impact on the grid. Click here to see how the UK currently uses it resources for electrical energy generation and for transport.
Methodology used for Electricity Demand Modelling
The team had to formulate a singular constant electrical demand value for a typical EV. The reason for this was that for it to be applied to each scenario, the value had to be constant for each scenario to be as comparable as possible. Through analysis of Government statistics on annual mileages of all 4-wheeled cars (1), we assumed that EVs would be travelling the same. This was due to cars travelling, on average, further distances in the past that what they are now. The trend of decreasing annual mileages of cars in the UK has continued for the past 40-50 years, but recently has plateaued since 2013, therefore we used this data. The most popular EV models currently on the global market were analysis for they're nameplate battery capacity and ranges. The models' battery capacity (kWh) and range (km) are as stated:
- Nissan leaf - 40kWh - 270km
- BMW i3 - 33kWh - 250km
- Tesla S - 100kWh - 540km
- Merc B-class - 28kWh - 200km
- Ford Focus E - 33.5kWh - 185km
- Chevrolet Bolt - 60kWh - 380km
- VW e-golf - 26.5kWh - 150km
- Tesla model X - 90kWh - 414km
Electrical Demand for Most Aggressive Scenario
It was calculated through our model that an extra 77TWh per annum would be required to sustain a 100% electric vehicle transition by 2050. To try to understand this electrical energy demand on a day to day basis (2), this energy was spread equally over the each day on a per-second basis to see how the power would align with current power demand. A demand profile was taken from the national grid on the 19th of March 2018, where the snow storm 'Beast from the East' hit the UK and the country experience peak demand in the year. However, this same method can be applied to any demand As shown below, this demonstates what the annual 92TWh of electricity would look like if it were evenly distributed over a peak-demand day, which equates to ~10.5GW.
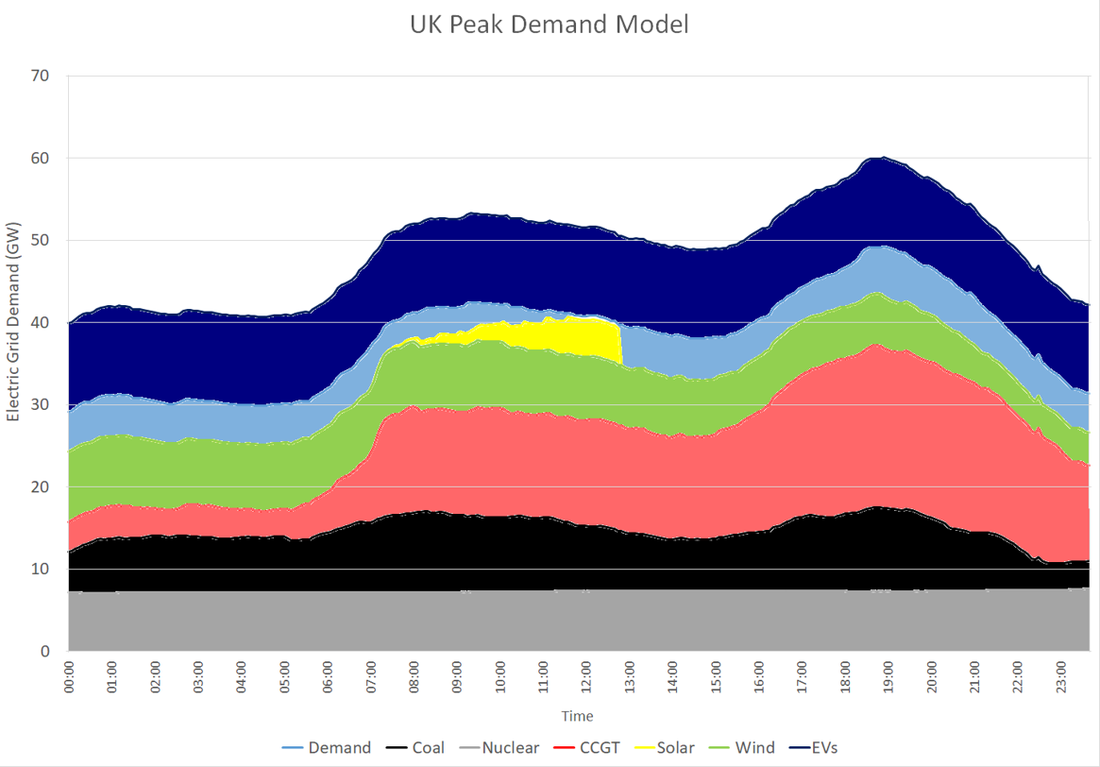
Figure 1: Equally Distributed Energy EV Demand Graph
It can be noted that the light blue area labelled 'demand' represents the rest of smaller scale energy sources such as hydro, pumped hydro, biomass and European interconnectors.
What ideal 'smart charging' could offer
Although highly unrealistic, this would be very ideal for both grid and power plant operators if smart/grid-controlled charging was implemented at a national scale. The trough in the electrical demand graph, experienced from 23:00 to 08:00 - where most people are in their bed sleeping - there is far less electricity being used, this could be instead 'filled' by people charging their electric vehicles as shown below. As optimistic as this sounds, this proves problematic, as it neglects complete battery charging and assumes peoples cars will travel the same distance each day.
The blue area shown below (fig 2) is same area as in the graph above (fig 1). This is to highlight that the area represents the total energy supplied during that day; as the area/integral of the power vs time (joules/second vs second) graph is energy.
The blue area shown below (fig 2) is same area as in the graph above (fig 1). This is to highlight that the area represents the total energy supplied during that day; as the area/integral of the power vs time (joules/second vs second) graph is energy.
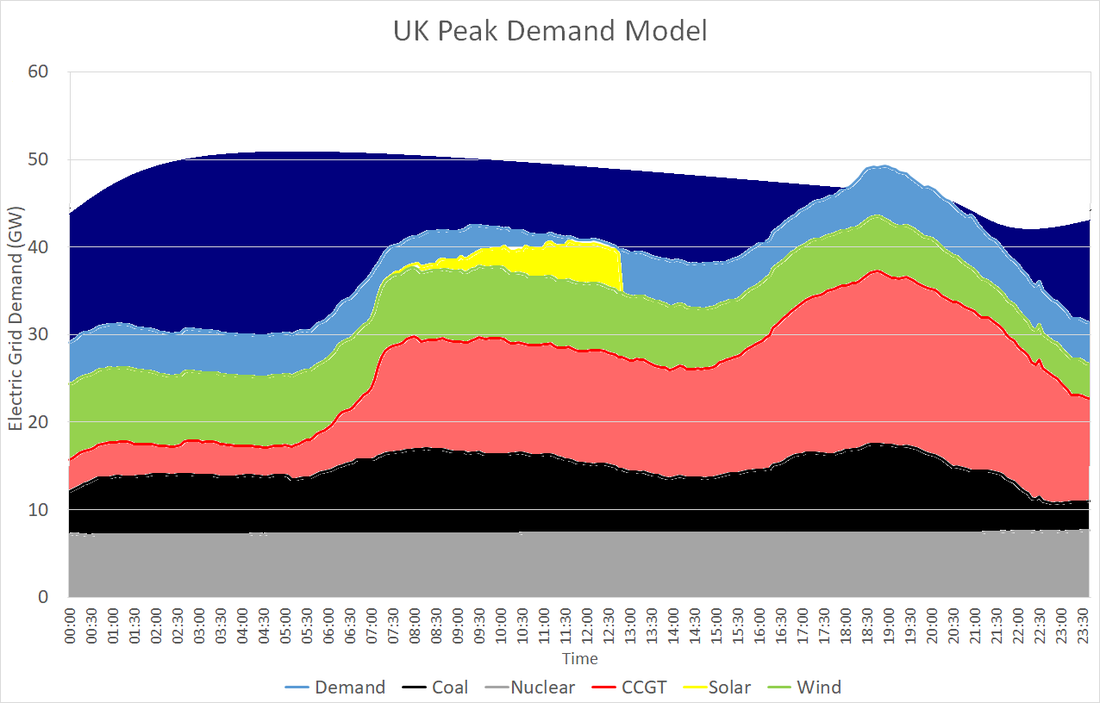
Figure 2: Ideally Distributed Energy EV Demand Graph
Using current supply-demand graphs the is the most accurate method of predicting how the energy can be distributed throughout the country on a day to day, hour to hour basis.
The Implications of Fast Charging at National Scale
It is already widely known that big electric car companies such as Tesla have made massive advancements in charging technology. One of the main downfalls of electric battery charging is the time required to stop and park a car to charge it over several hours. That being said, the introduction of fast chargers has became a topic of recent debate, with 7kW chargers being implemented into UK roads. This sounds like a massive break-through for the technology and for EV owners/potential customers, as cars on completely dead batteries can now be fully charged within 5-6 hours. The UK National Grid has stated that they predict a maximum of 20% of all electric vehicles in the future charging at the one time. With our most aggressive scenario, by 2050, this equates to 8.3 million EV's that could be charging at the one time. If this number of EV's were all using 7kW chargers, the impact this would have on the grid would be colossal, requiring an additional 60GW of capacity, and this could happen at any point during the day. This is completely enviable with our current maximum capacity of a mere 75GW, the country would need almost double of installed capacity.

Figure 3: Demand graph showing possible EV Charging Peaks
This demonstrates the stochastic nature of supply-demand matching and the challenges associated that the grid faces in the future if EV take over the market place. Be that as it may, if high EV market penetration does take place, charging behavior could be analysed as time progresses, therefore making charging behavior easier to predict for grid operators.
REFERENCES

(1) UK Government Statistical Data Set Table NTS0902
|
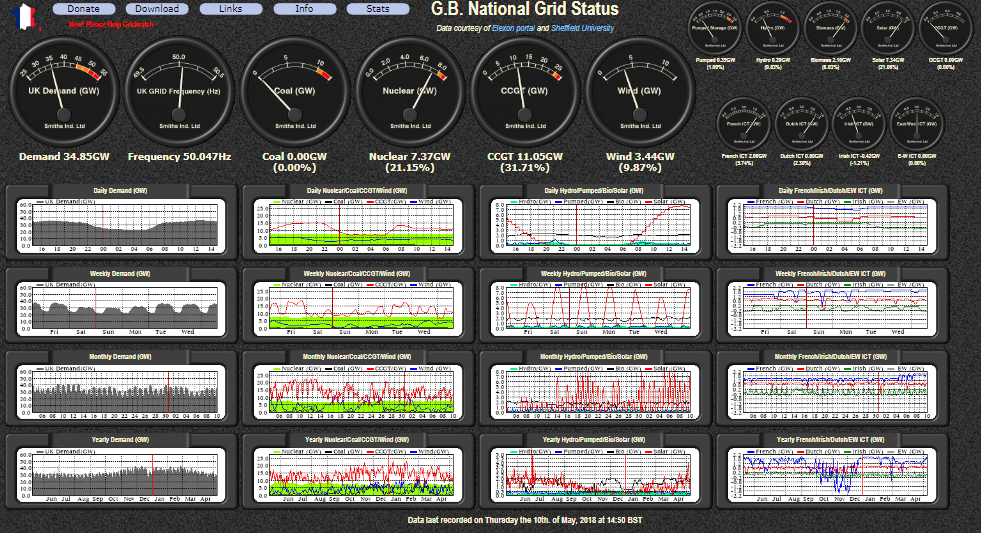
(2) GridWatch Live National UK Grid Analysis Tool
|