The 'S' Curve
It is assumed that a product that successfully transitions into the market, follows an ‘S’ shaped curve that represents its ratio in the market, and most importantly, how it progresses and finally saturates.
The mathematical tool used to derive an ‘S’ curve takes the following parameters:
Saturation percentage
This defines the ratio of the market, where the intended product will saturate, i.e. reach its maximum share of the market.
Start of fast growth
The year that, the ‘S’ curve will begin increasing faster. It is mathematically defined as the 10% of the saturation percentage. For example, if a product is said to saturate at 100% (full replacement), then the start of fast growth will link a specific year to the 10% of the share.
Takeover time
This is linked directly with ‘start of fast growth’. It defines the duration (in years) that it takes for the product to reach 90% of the saturation percentage, starting from the ‘start of fast growth’. For example, if saturation percentage is said to be 100%, the takeover time will be the duration for which the product will progress from 10% to 90%.
It is the duration of which the product is being adapted the fastest, with rates post 90% dropping until reaching saturation point.
- Saturation percentage
- Start of fast growth
- Takeover time
Saturation percentage
This defines the ratio of the market, where the intended product will saturate, i.e. reach its maximum share of the market.
Start of fast growth
The year that, the ‘S’ curve will begin increasing faster. It is mathematically defined as the 10% of the saturation percentage. For example, if a product is said to saturate at 100% (full replacement), then the start of fast growth will link a specific year to the 10% of the share.
Takeover time
This is linked directly with ‘start of fast growth’. It defines the duration (in years) that it takes for the product to reach 90% of the saturation percentage, starting from the ‘start of fast growth’. For example, if saturation percentage is said to be 100%, the takeover time will be the duration for which the product will progress from 10% to 90%.
It is the duration of which the product is being adapted the fastest, with rates post 90% dropping until reaching saturation point.
Market Ratio & Penetration Rates
The term 'Market Ratio' (MR) is simply the percentage of the introduced product to the existing market, and hence its ratio to its competitive products. In our case, the MR is an indication of the electric vehicles on the road, compared to the rest vehicles.
Penetration Rates (PRs)
The rate with which a product penetrates the market, is simply found by analysing the rate of change of the cumulative growth that is reflected from the market ratio. For a successful product that follows an ‘S’ shape, its rate of change will follow, by definition, a ‘bell’ curve.
The mathematical tool therefore expands to calculate the PRs, by taking the first derivative of the MR with respect to time.

Required Parameters for EV ToolHaving established the mathematical function for the intended geometry of the 'S' curve, and by adjusting the input parameters listed prior of saturation, start of fast growth, and takeover time, the tool then has the ability to calculate key results, such as an annual projection of different types of vehicles on the road up until 2050, or the lithium content requirement that will be needed to materialise such scenarios - assuming no recycling of lithium takes place, and a life-span of cars of ~10 years (which can be tweaked easily to change results).
|
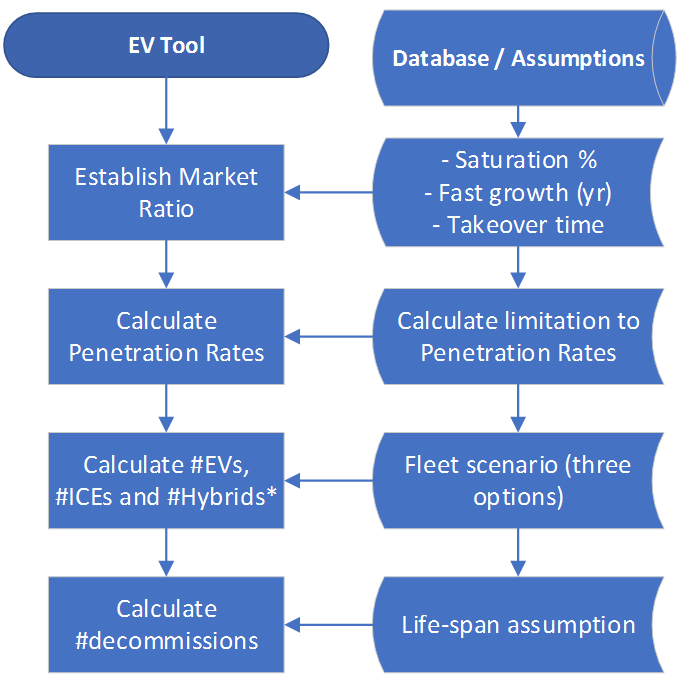
* Hybrid vehicles are not included in all scenarios
|
Model Validation
Generating a model that works for a scenario is one thing, but generating a dynamic, non-linear model that works for various scenarios is another. To validate the tool further, a number of steps are taken to reflect its robustness.
Example
To put numbers into perspective, and the EV Tool under a test, this example will set out a scenario with the following input parameters:
- Saturation 100%
- Start of fast growth 2025
- Takeover time 10 years
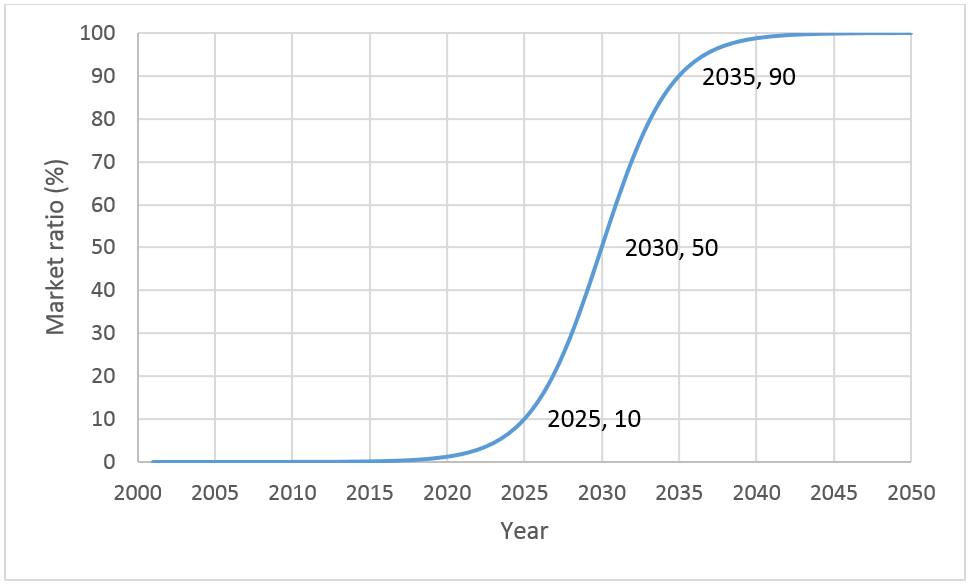
Market ratio for described example - 0 to 100%
|
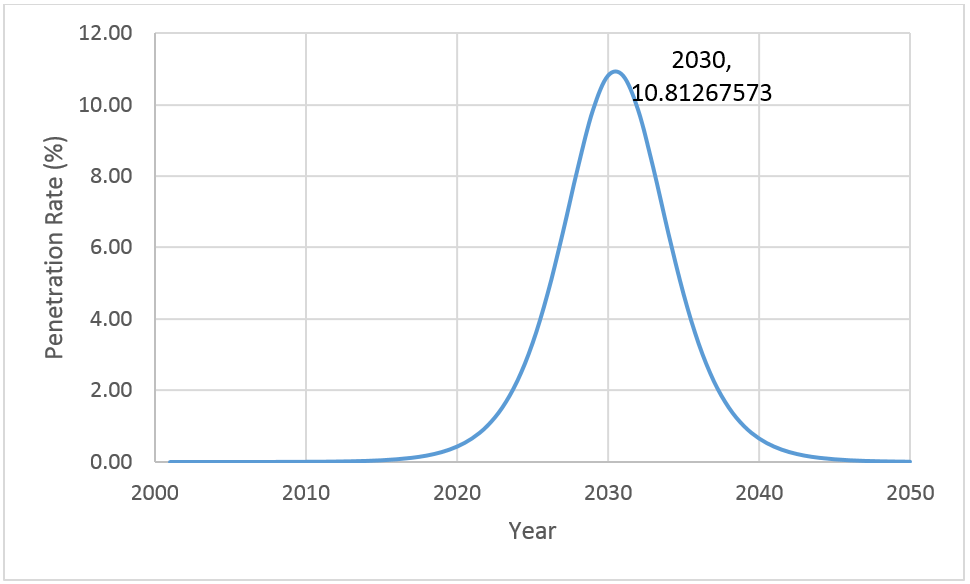
Penetration rates for described example
|
The Rate of Change of The Rate of Change of the Market Ratio
The second derivative of the market ratio, represents the rate of change of the penetration rates, which proves useful for ensuring that the assumed successful product follows a good progression.
The second derivative of the market ratio, represents the rate of change of the penetration rates, which proves useful for ensuring that the assumed successful product follows a good progression.
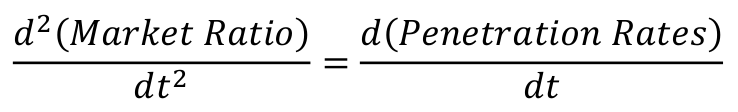
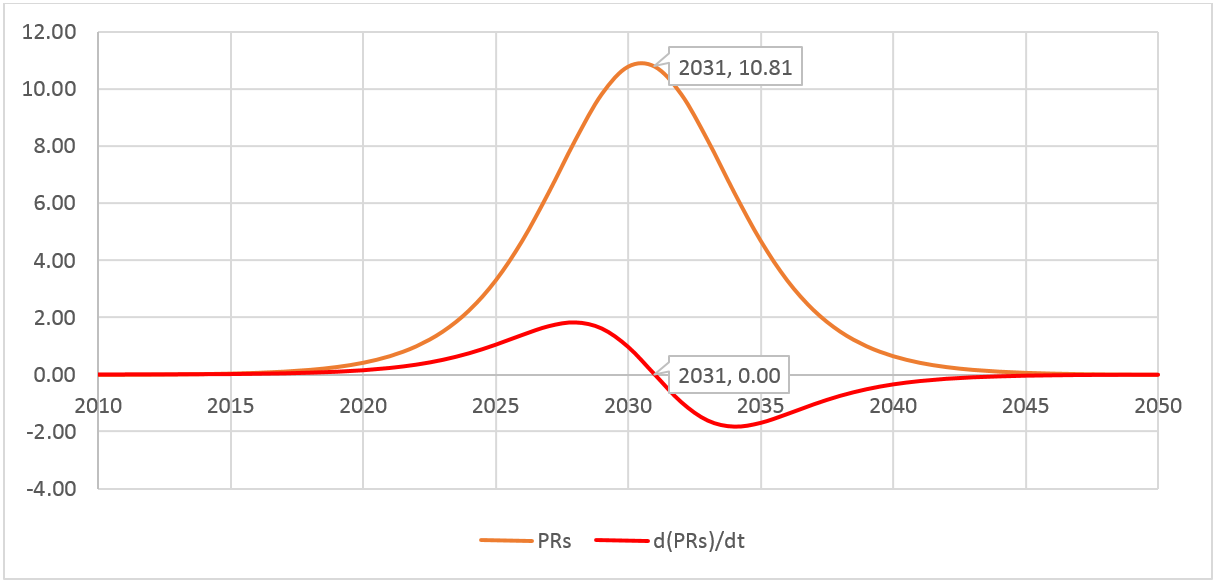
Building on the previous example of 100% saturation, the graph next illustrates the penetration rates and its second derivative.
The reason for that is to ensure that during the first decade or so, the penetration rates do not fluctuate between positive and negative growth. The idea is that a successfully rolled product that follows the ‘S’ curve, will only have negative rate of growth (second derivative) after the ‘bell’ curve starts its second half, for the example given this will be after 2031.
The reason for that is to ensure that during the first decade or so, the penetration rates do not fluctuate between positive and negative growth. The idea is that a successfully rolled product that follows the ‘S’ curve, will only have negative rate of growth (second derivative) after the ‘bell’ curve starts its second half, for the example given this will be after 2031.
Rate of change of penetration rates for described example
Penetration Rate Limitation
The limit of how fast a product can penetrate a market, is taken to be the current replacement rate of the products currently in use.
For example, let us imagine that for a fleet of 30 million cars, with 10% of them replaced per annum. That implies that the maximum possible penetration rate, can be 10% – that is all new cars coming in the market to be replaced entirely by electric vehicles.
In the EV Tool developed, a value is averaged between 2001 and 2016, years of which fleet data is reliably provided by the UK government.

Therefore, the maximum theoretical penetration rate is found to be 8.37%, which translates to no more than 8.37% of the total number of cars can be replaced per annum, and the maximum penetration electric vehicles can have would be that percentage multiplied by the total number of cars.
The example scenario analysed, with 100% saturation that starts its fast growth in 2025 lasting 10 years, peaks at 10.81% penetration rate, which exceeds the penetration rate limitation of 8.37%. Thus, the scenario is not feasible, and growth will have to be spread out further to be within the boundary conditions set. This is an easy way of testing a scenario, and setting out some boundary conditions for the scenarios' validation.
The example scenario analysed, with 100% saturation that starts its fast growth in 2025 lasting 10 years, peaks at 10.81% penetration rate, which exceeds the penetration rate limitation of 8.37%. Thus, the scenario is not feasible, and growth will have to be spread out further to be within the boundary conditions set. This is an easy way of testing a scenario, and setting out some boundary conditions for the scenarios' validation.
Database / Assumptions
This section outlines the data ‘infiltrating’ the model that gives volume and essence to a list of percentiles.
Fleet Scenarios
Up to this point, the tool has analysed market ratio, penetration rates and the theoretical limitation to those rates. To turn percentiles into number of vehicles, a reliable progression of the entire fleet is required. Due to the numerous uncertainties included in predicting accurately how the fleet will progress, three approaches were taken:
- Business as usual
- National Grid
- Department of Transport
From Vehicle Statistics to Modelling
When merging the vehicle statistics received from the UK government, to the vehicle data calculated through this model, there sometimes is a disagreement. To make sure that information simulated is not incorrect, the second derivative of the market ratio should be positive at the boundary of real | projected data. If otherwise, and the second derivative is negative, which would then imply that the penetration rate is decreasing, then a correction is required (because penetration rates are assumed to be increasing up until their peak value).
The correction taken in the EV Tool, is so that the second derivative remains at least 0, so that the penetration rates from the year previous remains static, with the market ratio showing a linear increase.
Total EV Sales
As mentioned already, the total EV sales are calculated as:

With the penetration rates following a ‘bell’ curve, and the fleet considered an external variable that does not affect the EV sales (because EV sales are taken as a percentage), then the total EV sales are solely dependent on the penetration rates. Therefore, when penetration rates start decreasing (second half of ‘bell’ curve), the total EV sales would also follow the same trend, building another ‘bell’ curve. This is wrong, as the equation does not consider re-purchases.
To get around this issue, an ‘if’ statement is built-in the equation so that after penetration rates start decreasing, the total EV sales’ equation changes for correction:
To get around this issue, an ‘if’ statement is built-in the equation so that after penetration rates start decreasing, the total EV sales’ equation changes for correction:

The assumption here is that when penetration rates start decreasing (for market ratio heading towards late-majority adapters and saturation), it is assumed that all new sales have reached the pre-configured target (saturation percentage).
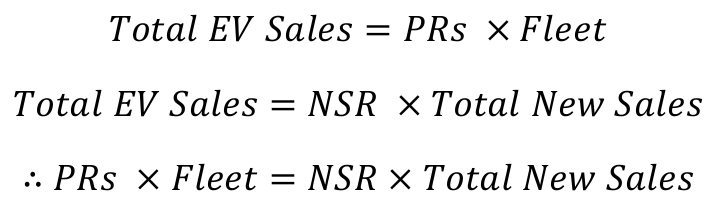
If we then assume that fleet and total new sales are constant, the penetration rates become linearly proportional to the new sales rate. In other words, the new sales rate will peak, when the penetration rates peak. So, if a policy requires a specific new sales rate at a given year (i.e. ICE ban – 2040) , then the model will have to show maximum penetration rate at that year.