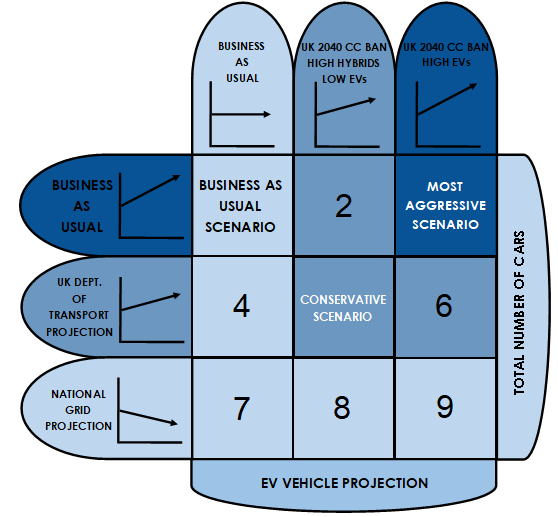
THE SCENARIO MATRIX
We can never know what exactly is going to happen in the future, but what we can do is make a set of predictions, through which we apply various assumptions and formulate several scenarios. By using the Number of Cars Projections and EV Projections, explained below, we were able to produce 9 permutations shown in our scenario matrix below. The scenarios are numbered 1-9, from left to right and top to bottom.
Total Number of Cars Projections
There were three main assumptions made for the total number of cars on the roads by 2040.
The National Grid Scenario
The National Grid, in one of their Future Energy Scenarios (FES) report, has stated that there will be a decline in the total number of cars from the current 2017 number of 31 million, down to 25 million.
UK Department for Transport Scenario
The UK Department for Transport predicted another value of 37 million cars by 2040.
Business as Usual Scenario
For the third total number of cars projection, we had used the last 15 years of vehicle registration data provided by the government's vehicle statistics and applied it.
In the last 15 years, UK roads have seen a steady, linear increase of the total cars registered by approximately 400,000 cars per year; this gave us our 'business as usual' total car projection, as applying this data to our model results in a total of 44 million cars by 2040.
For more information about the total number of cars projections, please visit our:
Electric Vehicle Projections
The next set of assumptions that had to be made was determining the different levels of how electric vehicles (EVs) can penetrate the British automotive market.
Business as Usual
The first was to assume if EV sales were to carry on as 'business as usual', since EV sales have been so low relative to diesel and petrol car sales in the past 10 years, we applied the same rates of sales to our model whilst also assuming that there would be no Government intervention whatsoever.
Intermediate
For the 'High Hybrids Low EVs' projection gave us our intermediate EV projection. In this model we had taken data of sales of hybrids and EVs from previous years and determined a ratio of hybrid-EV sales. This ratio was then applied to number of new cars being brought into the market for each to the total number of cars projection for each year progressing to 2050. This EV projection also took into consideration that the combustion engine ban does take place, hence massive penetration rates in the years leading up to 2040.
Shown below is extrapolated data from UK Government vehicle statistics, with the number of registered hybrids and EV from 2010-2016. Highlighted in blue, is the market ratio of EVs to Hybrids which was the value of 9.53 we used for modelling beyond 2016.

Figure 2: UK Government Statistical Data Set of Registered Cars by Fuel Type
Upper
Our third scenario for EV projections was the 'High EVs', which implemented the 2040 Government ban of conventional combustion vehicles, but replacing that only with fully BEVs, with the majority of the market ratio by 2050 owned by electric vehicles.
For a complete breakdown of our calculations and modelling of EVs, hybrids and combustion cars with respect to sales and market penetration, on a year by year analysis can be found by clicking below.
Our Three Main Scenarios
From the nine scenarios above, we have selected three to analyse in more detail. The Business as Usual scenario represents a baseline scenario. The Conservative scenario represent a potentially realistic progression of EV. The Aggressive scenario is the one with the highest number of EVs on the roads by 2050, and therefore this scenario allows us to identify the large impacts electric vehicles can have.
These results for these scenarios will be discussed in detail throughout the website, with the results for the further six scenarios available on our results page.
These results for these scenarios will be discussed in detail throughout the website, with the results for the further six scenarios available on our results page.
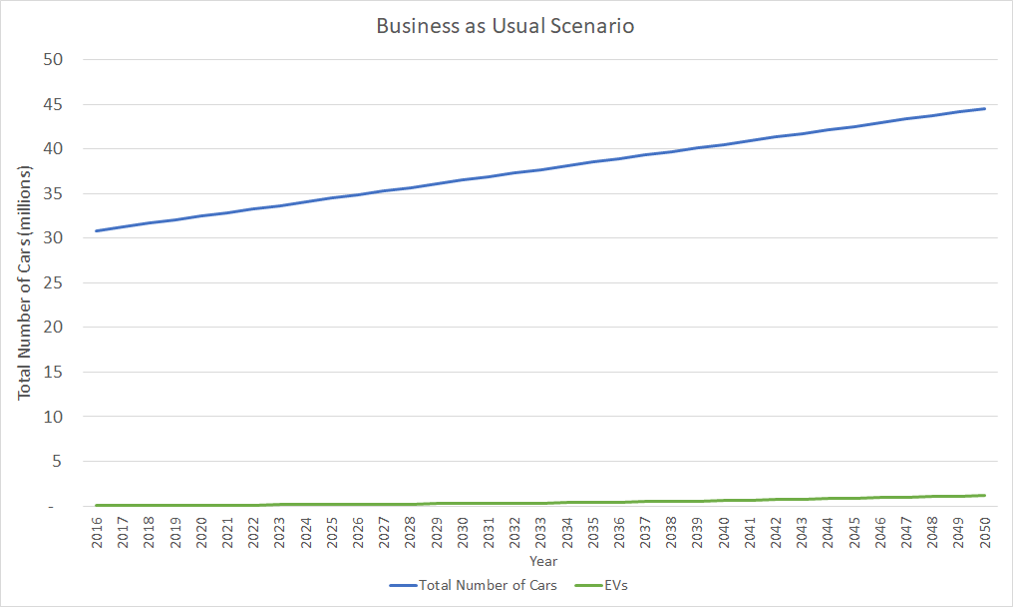
The Business as Usual Scenario
With both 'business as usual' total car projections and EV projections applied to our model, this was the resulting market projection as shown below. No Government ban on internal combustion engine vehicles had taken place. Previous trends in EV sales in the UK were applied to a model where we had taken previous trends in the UK's total number of cars registered. This was used as 'base case' model as it represents what the market would look like by 2050 if trends keep carrying on as they are.
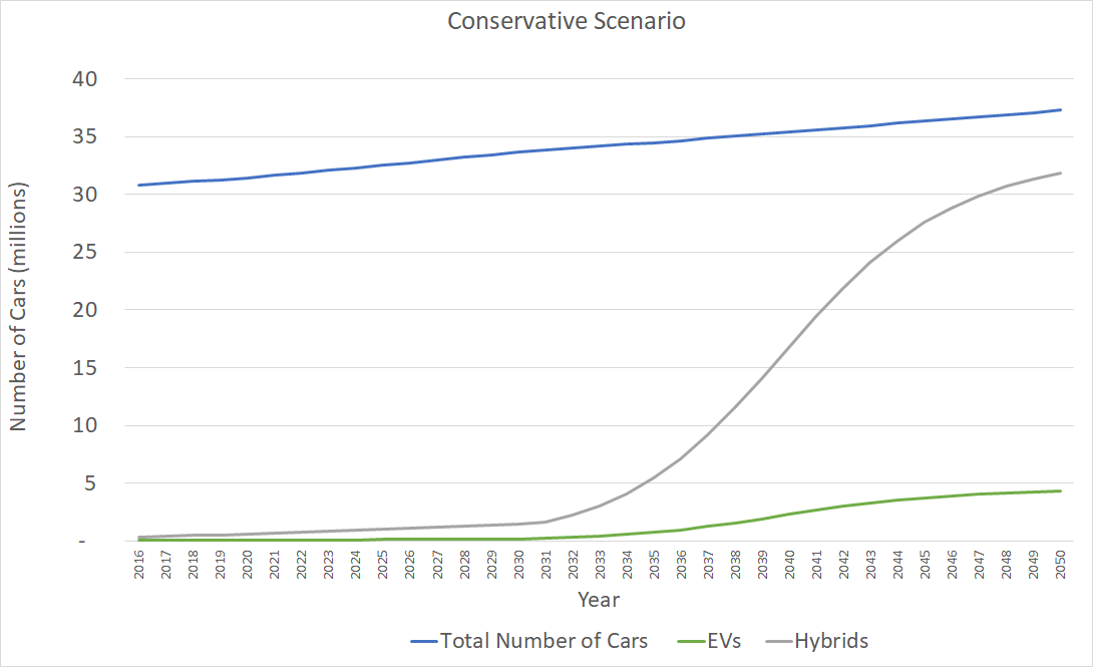
The Conservative Scenario
This scenario differs from the 'business as usual' model as the total number of cars on UK roads was modelled from the UK department for Transport's prediction of registered cars by 2050. Current sales ratio of hybrid cars to EVs was determined then were applied to this model. However, unlike the 'business as usual' EV projection, the internal combustion engine ban does take place, hence the massive penetration of hybrids/EVs from 2036 onwards.
The Aggressive Scenario
This model was essential in orchestrating and demonstrating the largest impacts electric vehicles could have for Great Britain, if the government ban does take place in 2040. The selected number of cars scenario for this model is the 'business as usual', therefore resulting in the highest total number of cars on the roads by 2050.
EVs have a majority of the market resulting in 43 million by 2050; the highest number of EVs out of all our nine scenario projections.
EVs have a majority of the market resulting in 43 million by 2050; the highest number of EVs out of all our nine scenario projections.