What will be the number of cars in Great Britain in 2050?
Well… the EV Group doesn’t have an answer for this question, but maybe the safest approach to mitigate this uncertainty is through modelling different future scenarios for the total number of cars in Great Britain.
All implications quantified (technical, economic…) depend on the number of electric vehicles, which has been defined as a percentage of the total number of cars through the EV Market Ratio. Thus, there is an implicit connection between the implications quantified and the total number of cars, which shows the high relevance of the number of cars for this project.
It has been decided to have three different total number of cars projections: “Business as Usual”, “Department for Transport” and “National Grid”, which will be explained hereunder:
Business as Usual Projection
Analyzing the number of licensed cars in Great Britain (1) for the last 15 years, it was found an average growth in the total number of cars of around 400,000 units per year.
It was extended this average growth until 2050, obtaining a total number of cars of 44.5 million for that year, in comparison with the nowadays 31 million cars.
It was extended this average growth until 2050, obtaining a total number of cars of 44.5 million for that year, in comparison with the nowadays 31 million cars.
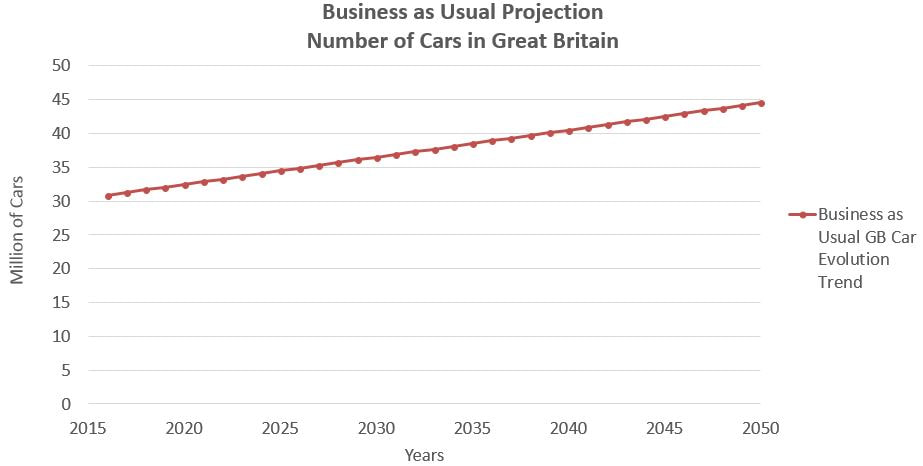
Figure 1. Business as Usual Projection for the Number of Cars in Great Britain
The Business as Usual is the projection which provides the highest number of total cars in the road for 2050.
Department for Transport Projection
This projection owes its name to the UK Department for Transport, the source where the data has been obtained from.
The UK Department for Transport only provides forecasts for the number of cars in England, but not for the Great Britain.
The Department for Transport provides, in total, five different car forecasts. Four of them predicts the future number of cars as an increase percentage of the nowadays number of cars (2), and the fifth forecast bases its car predictions in the future number of households and the number of cars per household (3).
It was found that the average increase in the number of cars per region in Great Britain over the last 20 years (England, Wales and Scotland) has a similar percentage of increase, so the England forecast will be applied to obtain the number of cars of the whole Great Britain.
Analyzing the results, forecasts with higher number of cars in 2040 have a similar value than the “Business as Usual Projection” for this year. To offer a wider model which provides very different possible scenarios, it was selected as the “Department for Transport Car Projection” the forecast which provides the smaller future increase in the numbers of cars, accounting for 37 million of cars in the road in 2050, in comparison with 31 million nowadays value.
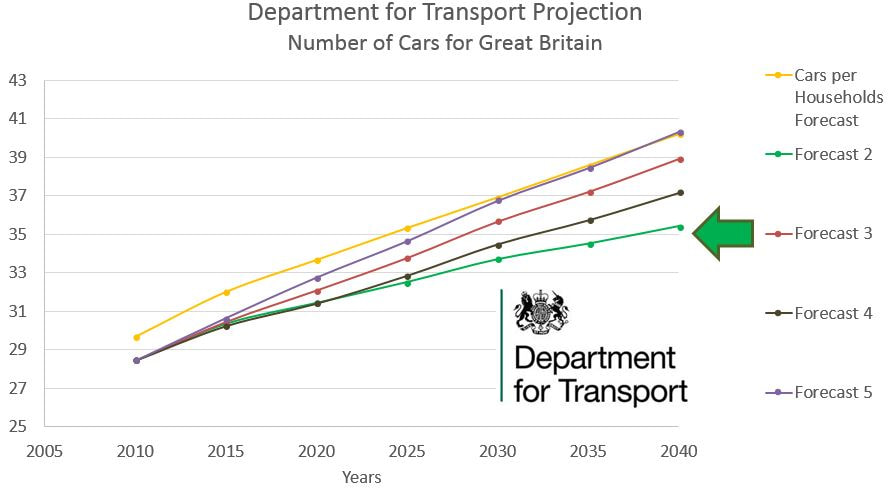
Figure 2. Five different number of car forecast for Great Britain by the Department for Transport
National Grid Projection
This projection has been obtained through the analysis of the different growths for the number of cars proposed by the National Grid in its Future Energy Scenarios.
It was decided that the most interesting scenario “Two Degrees Scenario” (4), which provides a reduction in the total number of cars, level off to 25 million vehicles by 2050 (5 million less cars than today). This scenario is based in the arising of technologies like shared-autonomous vehicles and teleworking, which have a great contribution in the number of cars reduction.
It was decided that the most interesting scenario “Two Degrees Scenario” (4), which provides a reduction in the total number of cars, level off to 25 million vehicles by 2050 (5 million less cars than today). This scenario is based in the arising of technologies like shared-autonomous vehicles and teleworking, which have a great contribution in the number of cars reduction.
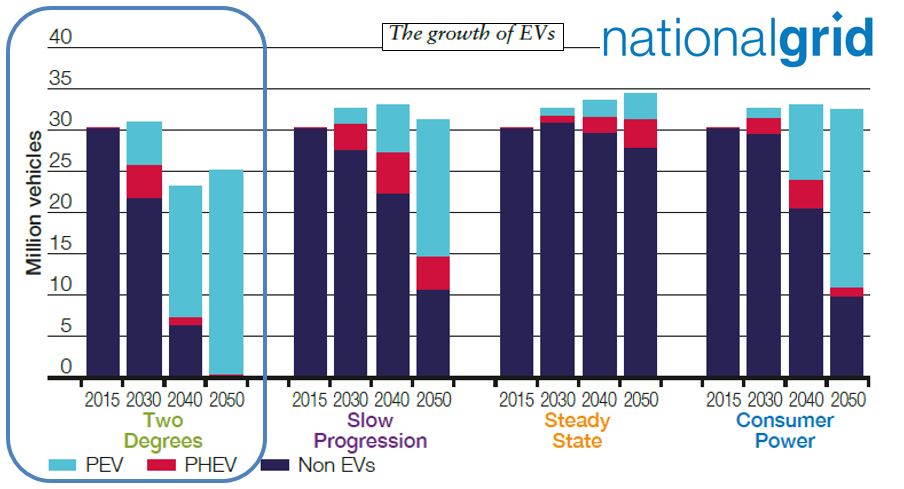
Figure 3. Different growth in the number of cars provided by the National Grid in its Future Energy Scenarios
TOTAL NUMBER OF CARS PROJECTIONS
All the information contained in this section has been summarized in the next paragraph, where an interactive graph is also provided:
Compared with the nowadays 31 million cars in the road, the “Business as usual Projection” provides the higher number of cars with 44 million by 2050, the “Department for Transport Projection” is 37 million and the “National Grid Projection” level off to 25 million of cars.
Compared with the nowadays 31 million cars in the road, the “Business as usual Projection” provides the higher number of cars with 44 million by 2050, the “Department for Transport Projection” is 37 million and the “National Grid Projection” level off to 25 million of cars.
The combination of the different EV growths with the three different Number of Car Projections explained, creates the one of the key parts of the project: the 9 different EVs Scenarios, which is described in detail in the following section.
REFERENCES

(1) and (2). Transport Statistics Great Britain 2017. UK Department for Transport (Pages 272 to 273) and (Pages 211 to 215).
|

(3). Road Traffic Forecasts 2015 (Pages 20 and 41).
|
(3) Future Energy Scenarios 2017. National Grid (Page 40).
|