The grid was mainly built in the 1950’s and 60’s, where the energy was predominantly coming from coal-fired power stations, that were built near the mines; making the former mining regions the most reinforced in terms of their transmission capacities.
The grid in Great Britain currently, is divided into two distinct categories:
The first one, and arguably the most important one, is the ‘motorway’ of the grid, or 'super grid', that accommodates the bulk energy transfer across the national boundaries. In Scotland, this includes voltage from 132kV to 400kV, where in England and Wales from 275kV to 400kV.
The second one, is where the grid steps off the ‘motorway’, or NETS, to distribute energy to regions and spread into cities and neighbourhoods.
- National Electricity Transmission System (NETS)
- Distribution Network
The first one, and arguably the most important one, is the ‘motorway’ of the grid, or 'super grid', that accommodates the bulk energy transfer across the national boundaries. In Scotland, this includes voltage from 132kV to 400kV, where in England and Wales from 275kV to 400kV.
The second one, is where the grid steps off the ‘motorway’, or NETS, to distribute energy to regions and spread into cities and neighbourhoods.
Grid Network
The grid in general, is comprised of four scales according to the voltage level they carry, mainly for safety reasons. The higher the voltage, the higher the potential dangers associated with it (assuming there is enough current to materialise hazardous environments).
The typical ‘steps’ of voltage in Great Britain, are as outlined: 230V, 400V, 11kV, 33kV, 132kV, 275kV and 400kV.
The four voltage classes, are as follows (1):
With the NETS operating in HV and EHV classes, and the Distribution Network in LV to early HV.
The grid in general, is comprised of four scales according to the voltage level they carry, mainly for safety reasons. The higher the voltage, the higher the potential dangers associated with it (assuming there is enough current to materialise hazardous environments).
The typical ‘steps’ of voltage in Great Britain, are as outlined: 230V, 400V, 11kV, 33kV, 132kV, 275kV and 400kV.
The four voltage classes, are as follows (1):
- Low Voltage (LV) – 0 to 1kV
- Medium Voltage (MV) – 1kV to 35kV
- High Voltage (HV) – 35kV to 230kV
- Extra-High Voltage (EHV) – 230kV to 1200kV
With the NETS operating in HV and EHV classes, and the Distribution Network in LV to early HV.
Quantifying the grid
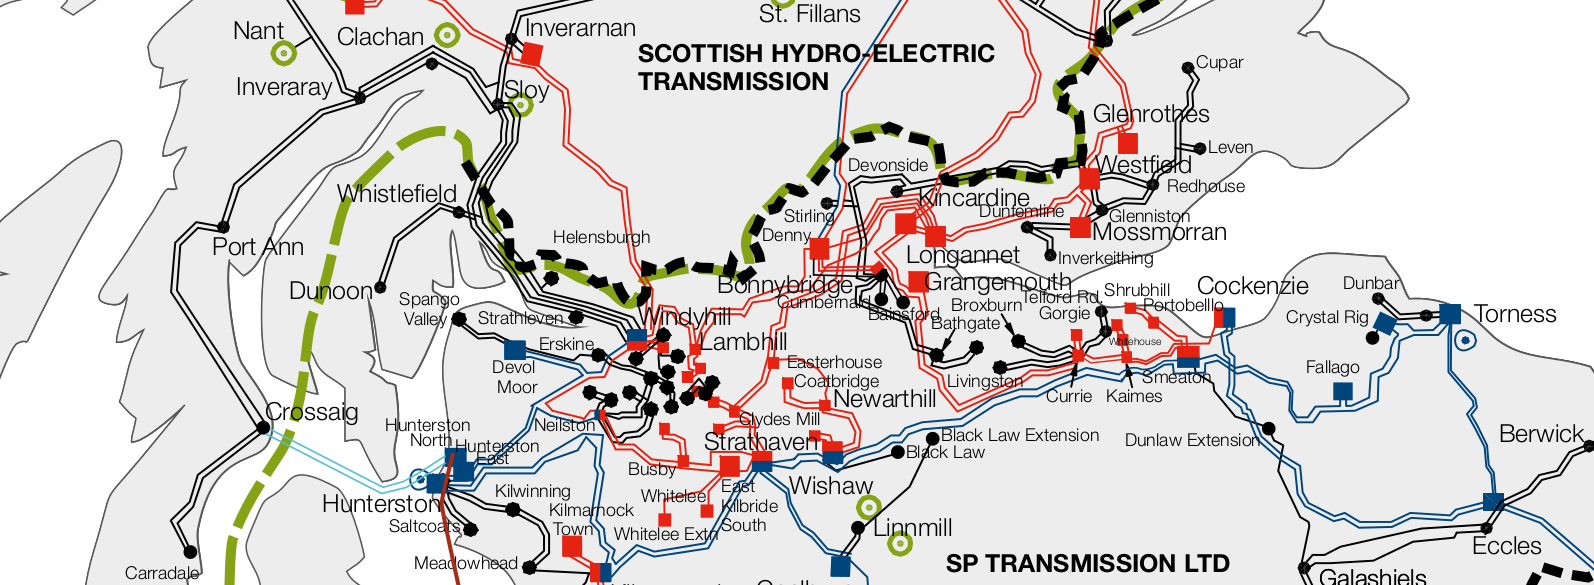
National Electricity Transmission System (NETS) - Scotland's central belt
|
Distance
The easiest way to quantify the grid’s requirements, and bypassing the non-disclosure agreements that resist the necessary transparency to make academic and sound analysis, is to find the distance of each class. This approach allows for a scalable quantification of the percentage requiring an upgrade, that itself is a function of the total number of electric vehicles per region, and the degree of which managed charging is introduced. International Energy Agency: Energy Technology System Analysis Program (IEA-ETSAP) A study by IEA-ETSAP, published in 2014, is a well-documented report describing the current infrastructure throughout Europe, regarding electricity transmission and distribution (2). It expands further the advantages of rolling out high voltage DC (HVDC) transmission systems, that have the potential of drastically reducing the currently present transmission losses, especially when sub-sea, and over long distances. |
|
The entire Distribution Network in the United Kingdom as of 2011, is quantified to be 837,156km long, according to IEA-ETSAP, that also provides a breakdown of the distance for different classes of voltage networks within the Distribution Network class.
|
Distribution Network Breakdown - IEA-ETSAP
|
Breakdown from Parliamentary Office of Science and Technology
Distribution Network According o a 'Parliamentary Office of Science and Technology' report (3), the Distribution Network is analysed to be approximately 800,00km, supplying energy from 230 to 132kV. National Electricity Transmission System (NETS)
The NETS, runs for an approximate of 25,000km, supplying energy from 132 to 400kV (3). |
Low Voltage Network
Most of the LV networks are underground cables, at a length of 338,599km. When including the over-head cables, it is a combining total of 408,875km.
Low Voltage Limitations(source)
The limitations to the LV network is divided into two principle ways:
Most of the LV networks are underground cables, at a length of 338,599km. When including the over-head cables, it is a combining total of 408,875km.
Low Voltage Limitations(source)
The limitations to the LV network is divided into two principle ways:
- Thermal violation - indicating a growth in demand
- Voltage violation - indicating a growth in embedded generation
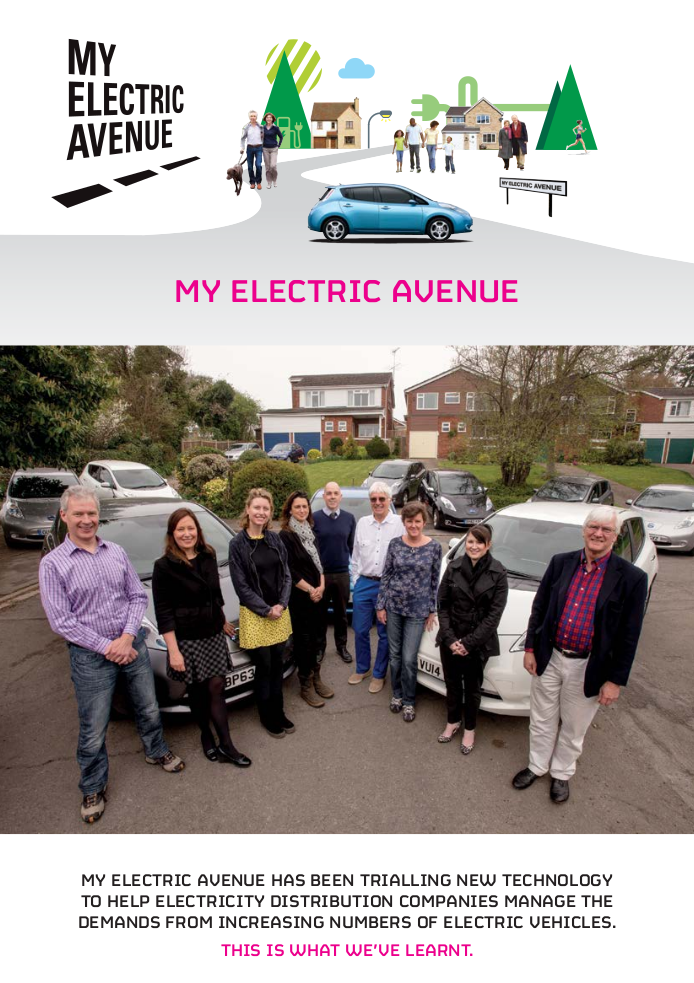
EA Technology - My Electric Avenue
Managed Electric Vehicle Charging
To ensure that LV networks remain within safe limits of electricity distribution, technologies like MEVC will be looking less and less optional as we progress.
If a LV network is connected to 100 households, managing when EVs choose to charge is essential, since allowing a consumerism market to unfold will result in the underground LV networks to a meltdown, and non-EV customers will be affected as much, from potential power-cuts.
A study led by EA Technology, through their project ‘My Electric Avenue’ (4), has shown that a typical reduction in charging was dropping the power rate to 50% of its capacity, for 30 minutes.
The real question however, is that the network’s breakdown should not be an option, and to ensure its robustness, a MEVC must be in place.
REFERENCES
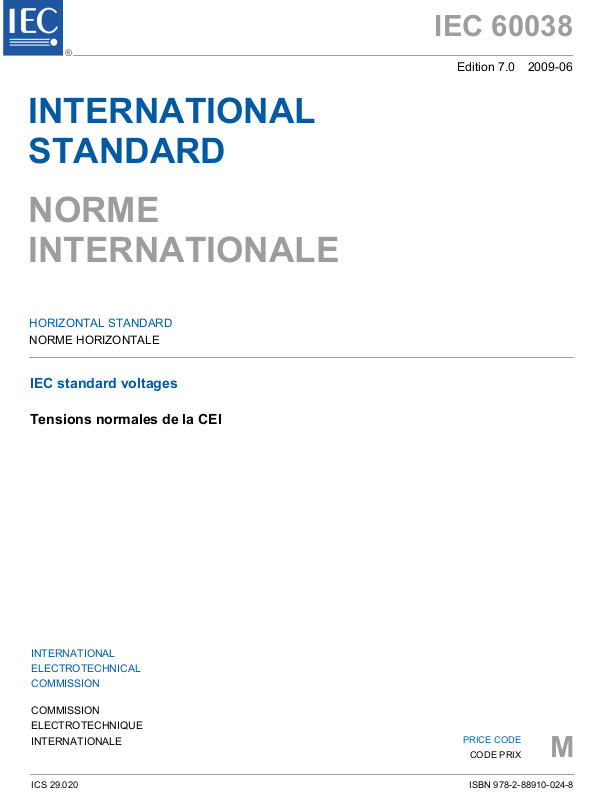
(1) IEC 60038
|
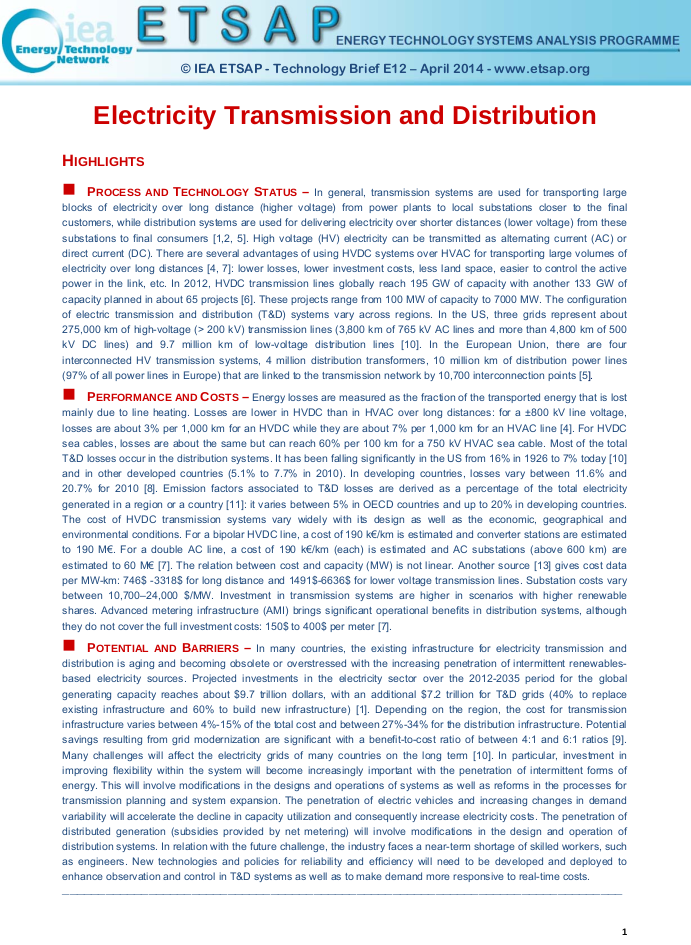
(2) International Energy Agency - Electricity Transmission & Distribution
|

(3) Office of Science & Technology - Postnote - Electricity in the UK
(4) My Electric Avenue
|