How much money the Government is losing in fuel taxes due to EV Transition?
As it is expressed in the title, the main purpose of this section is to quantify how much money relative to fuel taxes, the Government is renouncing to collect per each Electric Vehicle (EV) in the road.
To calculate this value, it was necessary the know the UK number of petrol and diesel cars (1), the UK car petroleum consumption (2) and the Government tax revenue per litre of fuel consumed (3). See Figure 1.
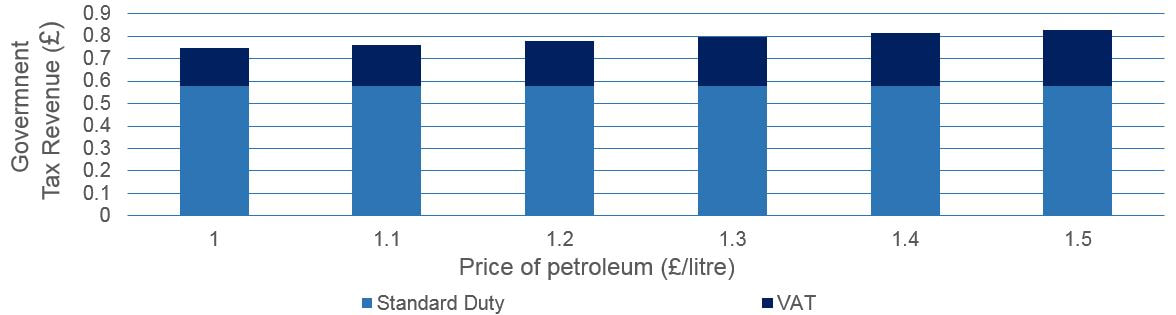
Figure 1. Fuel Breakdown Costs
After calculating the average between petrol and diesel cars, results show that the UK Government has an annual tax revenue of around £700 per each conventional car in the road.
If the driver decides to buy an EV instead of a conventional internal combustion engine car, the Government will lose around £700 annually in its tax revenue per each EV in the road. See Figure 2.
If the driver decides to buy an EV instead of a conventional internal combustion engine car, the Government will lose around £700 annually in its tax revenue per each EV in the road. See Figure 2.

Figure 2. From Petrol and Diesel fuel tax revenue to Annual Fuel Tax Loss per Electric Vehicle
Analysing the nowadays number of EVs (around 33 thousand), the Government is already losing around £30 million pounds per year in its tax revenue budget, and this is only the start point of the EV Transition.
It has been quantified this lost revenue for the different scenarios in 2050, depending on the number of EVs in the road, and for the most aggressive scenario, with 43 million EVs, the Government would lose, in its tax revenue, up to 32 billion pounds each year! See Figure 3.
To understand better the magnitude of this £32 billion per year, is equivalent to the UK Public Sector Expending in the whole Transport Sector (35 billion) or one third of the UK Public Sector Expending in Education (£ 103 billion per year).

Figure 3. Government Revenue Lost for the nowadays number of EVs and for the different Electric Vehicle Scenarios in 2050
Conclusions
- an EV Transition implies an important loss in tax revenue related with oil fuel consumption, which is not so visible with nowadays number of EVs, but it will be when EVs had a higher share of the total number of cars.
- The Government needs to find the way of recovering this revenue lost, which probably will be related with electricity charging prices.
In the next section it would be covered one possibility of how the Government could recover this lost revenue through changes in the electricity prices for charging the Electric Vehicle and it will be explained how this would change the consumer electricity bill.
REFERENCES
(1) Number of Petrol and Diesel Cars in the UK. Transport Statistics Great Britain 2017.
|

(2) Petrol and Diesel Car Consumption in the UK. Department for Transport
|

(3) Fuel prices explained: A breakdown of the cost of petrol and diesel. Office for National Statistics
|