Sites
The first step for analysing the resources available for both of the devices was to choose the correct sites, as the outcome of the project depended on finding out how each of our wave energy device types would perform in a variety of sites.
Before the sites were selected, the most optimal wave resource distribution was checked on information map sites. The four sites that were chosen were based upon data available, which was given by “www.puertos.es” a government sponsored website. The reason behind choosing Europe as the main wave resource site was due to the fact that past research has shown that these sites have a high potential in kilowatt per meter of waves.
The sites selected for this project were:
|

|
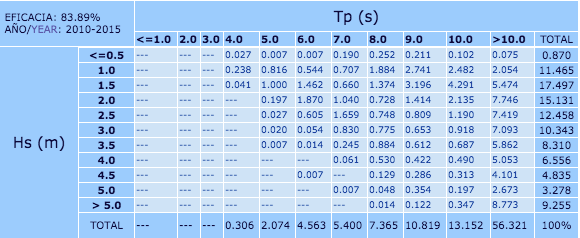
The wave resource matrixes for each site were downloaded (left figure) and then converted into the
total amount of hours over a 5 year span (right). These tables are shown below and for each site:

Wave resource for North Uist. Source: www.puertos.es
|

Converted wave resource for North Uist
|
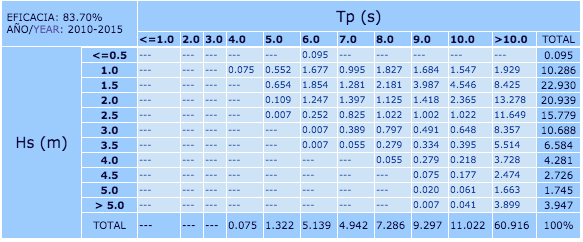
Wave resource for East of Tiree. Source: www.puertos.es
|

Converted resource for East of Tiree
|
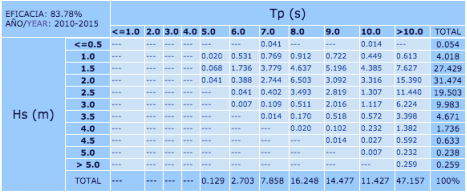
Wave resource for Gijón. Source: www.puertos.es
|

Converted resource for Gijón
|
Wave resource for North of Tenerife. Source: www.puertos.es
|

Converted resource for North of Tenerife
|
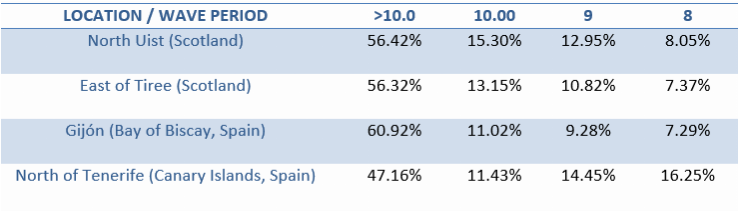
The following table shows the four sites selected described in function of the percentage of the different wave period each have:
To access the matrixes we used, you can download the excel file in the "Derivables" sections.