Power Curves
An important part that enables us to carry out the sensitivity analysis for both of the devices was to analyse the power performance of each of the devices. This involved the usage of wave power theory formulas for the point absorber and a "Mathcad" performance analysis for the attenuator device, due to its more complex structure. The performance matrixes of both devices were obtained from data available from the manufacturers.
The analysis performed in "Mathcad" for the attenuator device can be summarised as follows:
The device's segments were split into 10 elements and then a series of calculations were done:
The analysis performed in "Mathcad" for the attenuator device can be summarised as follows:
The device's segments were split into 10 elements and then a series of calculations were done:
- Froude Kyrlov & added mass inertia force (loading),
- Structural mass,
- Hydrodynamic added mass,
- Hydrostatic stiffness (presented from the buoyancy),
- Power generation (shown by dampers from the joints),
- Evaluation of performance in different sea states.
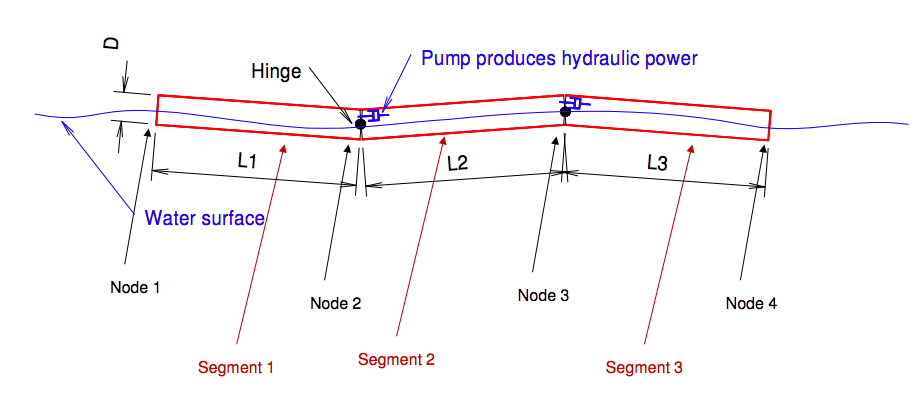
How the attenuator is split for calculations to be done. Source: NM969 - Renewable Marine Energy Sytems
For the technical analysis of the point absorber, the following formulas were used in order to calculate the parameters required to perform the power curves.
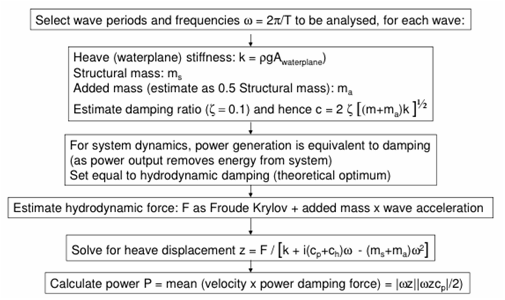
Formulas used for the point absorber. Source: NM969 - Renewable Marine Energy Systems
The performance matrixes of both devices look like this:

Source: Pelamis Wave Power
|

Source: Finavera Renewables
|
With all the above paramerters now calculated, all the data was put together in an excel file. This file includes the individual technical performance of each of the devices and the wave resource, which allowed us to perform a sensitivity analysis afterwards (it is downloadable in the "Deliverables" section).
Excel file where all calculations were done
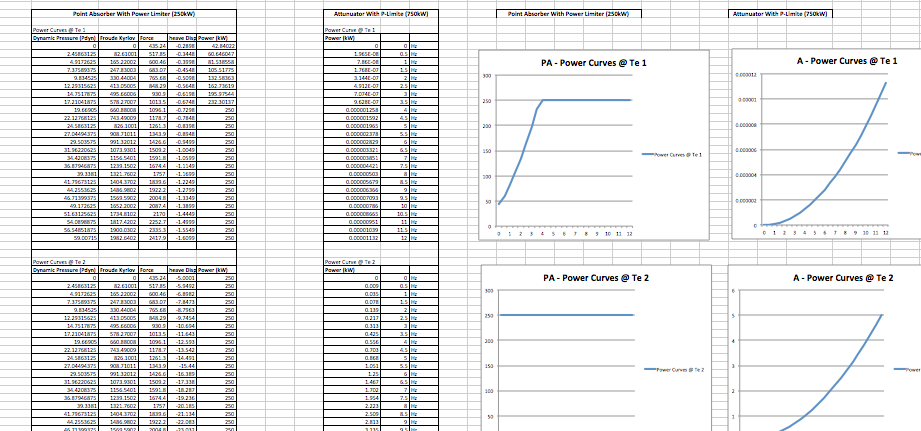
The excel analysis of both of the device types puts them in a variety of ocean wave frequencies and time periods. With the stated power predictions and the wave theory formula, a theoretical insight on how these devices would perform in each scenario is obtained. These power predictions are used to model power curves, obtaining the graphs shown below:


The results show the device's most optimal states in terms of functionality/power output. We can see that the attenuator device works optimally for less wave periods than the point absorber. This means that the point absorber is able to operate more efficiently in any kind of site with enough wave resource, while the attenuator needs requirements such as minimum wave height or wave period.