What affects the costs in wave energy devices?
We can always talk about two types of costs: capital costs and operation and maintenance (O&M) costs. For the first ones, they can be divided into different sectors. It takes account the device itself and mechanical systems, energy conversion, electrical system and project management. The device includes all the components that makes it up, excluding the energy conversion system (power take off elements such as hydraulic pistons and motors, gearboxes, frequency converters and electrical generators). In the mechanical system we can include moorings or foundations and others that are required for the device to be held up together. The electrical system integrates the energy conversion plus all the subsea cables and connections required for the transmission, and the project management costs consist of the whole installation, commissioning, decommissioning and monitoring processes. In the following figure we can see graphically how the costs are segmented for one wave energy device. To the right of it, we can see how costs vary if an array (more than one device) is installed.
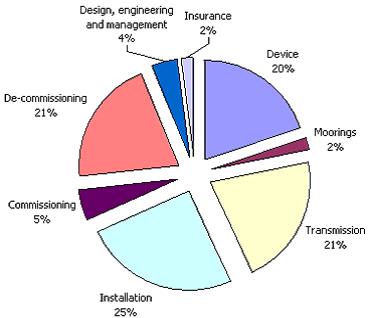
Costs distribution for a single device, Source: Carbon Trust
|

Cost distribution for an array. Source: Carbon Trust
|
The the structure itself will become cheaper in an array as it is more economical to buy in big scale. Also the mooring systems can be reduced as the same mooring points could be used. On the other hand, as it is logical, the installation costs as more devices are deployed. There are also other factors which can fluctuate costs such as:
- distance to shore (the further, the higher),
- architectural type of the device and its overall size,
- project’s location (wave forces, weather conditions),
- type of vessels required for deployment,
- survivability.
On the other hand, O&M costs consist of scheduled and unexpected repairs (as there still a big uncertainty of the device’s reliability), licences and generate electricity at the location, insurance, and controlling activities. For this sector, it is important to maximise availability of operation but minimising costs.
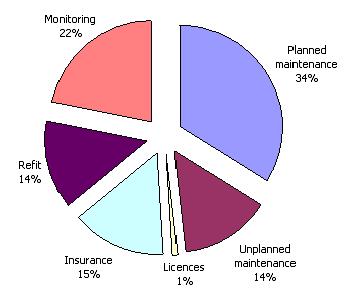
O&M cost distribution for a single device. Source: Carbon Trust
|

O&M cost distribution for an array. Source: Carbon Trust
|
Again, the costs will depend on the size of the project. Some things are maintained the same, as it is for licenses or insurance, while others such as unexpected maintenance nearly doubles. Moreover, the costs here will once more depend on the factors mentioned above. These will also depend on if the maintenance is done onshore or offshore, the frequency they need to be done and the weather conditions allowing or not the operation to take place. It is also important to state that this costs are likely to vary from year to year, and it is probable that the costs will be higher during the first years of operation due to the lack of experience.