Energy Evaluation
The power output for each of the devices (point absorber and attenuator) was calculated in "Microsoft Excel" using the device’s performance
matrix in each of the selected sites. "Carbon Trust" and "Puertos del Estado" provided the wave height and period information. The power matrices for both devices were taken from previous research, device brochures, and crosschecked
using formula given by a variety of wave energy research papers. The annual
power for each of the devices in the chosen sites was then tabulated and used
in the sensitivity analysis as shown in the following table:
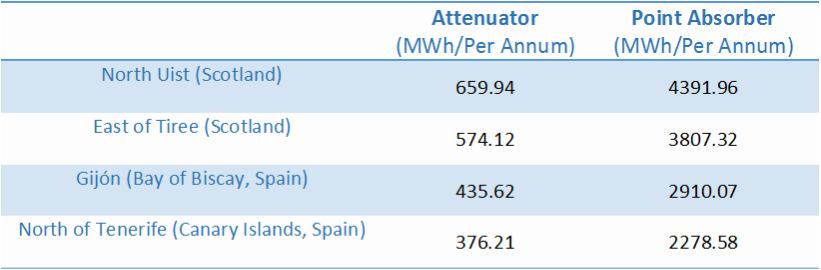
Wave resource of our selected sites
As we can see from the table, the highest potential site is North Uist, followed by East of Tiree, both in Scotland. Tenerife is the site with least potential, nearly halving Scotland's sites. From the performance of the devices, we can directly see that the point absorber captures way more energy than the attenuator, independently from the site where they operate in.
The devices were analysed in more detail to understand how they work under different wave resource and to enable us to compare them by using power curves.
