Levelised Cost of Energy (LCOE)
To relate both the energy performance and the costs, the levelised cost of energy is used. They are the net present value of the cost per kWh of electricity, over the lifetime of a generating source. It depends on all the costs involved in the project, which are the capital costs, operation and maintenance, and decommissioning. It is an important figure which enables to compare different energy sources as it is a measure of the overall competitiveness of the different generation technologies.
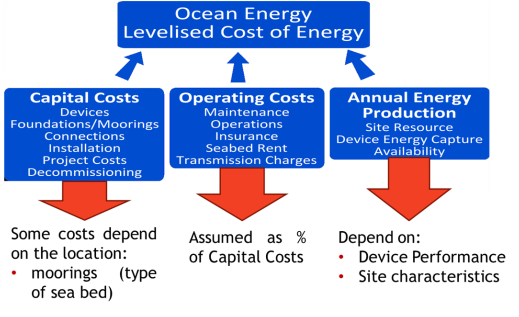
What affects levelised cost of energy
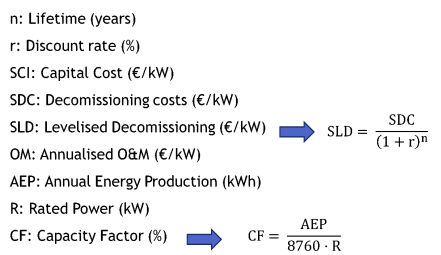
The variables and formulas used to calculate them are the following:
|

|
In the formula there are two significant factors: the lifetime
of the device which is its
expected survivability, and
the discount rate that is
the percentage associated to the risk in a project inversion. The
capacity
factor will show the availability of the device to work on a specific site.
We first decided to model the costs involved in a theoretical wave energy project, which consist of a 15 years survivability for the devices, and a discount rate of 12%. These were the results:
We first decided to model the costs involved in a theoretical wave energy project, which consist of a 15 years survivability for the devices, and a discount rate of 12%. These were the results:
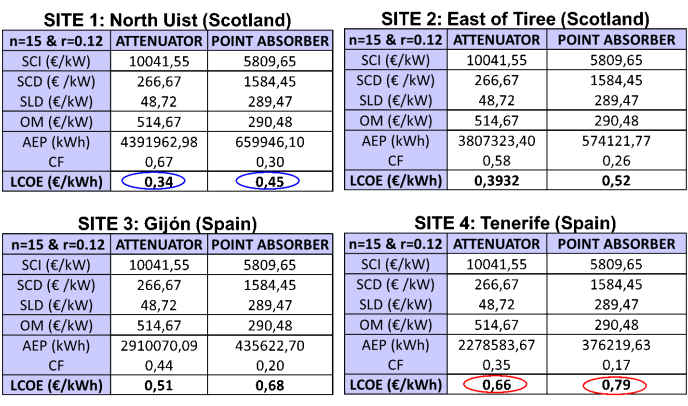
As we can see from the figures, the best
site was North Uist for both devices, with 0.34€/kWh
for attenuator and 0.45€/kWh for point absorber. The worst location was
Tenerife nearly doubling the values.
We then changed the values searching for competitiveness and so increased the life expectancy of the devices to 20 years and decreased the discount rate to 8%. The results, as we can see in the next table, were that the costs are reduced in North Uist by nearly 0.10€/kWh, while in Tenerife around 0.15€/kWh.
We then changed the values searching for competitiveness and so increased the life expectancy of the devices to 20 years and decreased the discount rate to 8%. The results, as we can see in the next table, were that the costs are reduced in North Uist by nearly 0.10€/kWh, while in Tenerife around 0.15€/kWh.

Finally, we thought it would be interesting to model where we
think wave energy is nowadays. We chose only 5 years for the device’s
survivability as it is one of the most significant challenges wave energy
industry has yet to overcome, and 14% the discount rate, as we think the market is still not ready to invest in this kind of projects due to the technical and financial risks they
involve. These were the outcomes:

As wee can see from the figures, the costs increase dramatically, making wave energy quite unfeasible for those entered values.