


Defrost cycle
Frost formation on the outdoor heat exchanger (evaporator) is one of the major problems for air source heat pump. In certain conditions with relatively high humidity, the water in the air can condense on the pipes of the evaporator and freeze if the temperature of the evaporator is below zero.
The formation of the ice will have 2 main consequences on the heat pump performance. First, a layer of ice will decrease the heat transfer from the outside air to the refrigerant inside the pipes of the evaporator. It will act as an insulating layer which will decrease the performance of the heat pump. To maintain a certain heating capacity, the device will have to decrease the temperature of the refrigerant in the evaporator by increasing the work of the compressor. Secondly, the ice will obstruct the air flow through the evaporator. It will tend to increase the fan work and will reduce the efficiency of the heat transfer.
Many methods can be used to remove the ice formed on the evaporator. One of the most common is to use the hot refrigerant at high pressure through the evaporator. This is the method used in the Sanyo Eco Cute System.
Defrost cycle of Sanyo Eco cute
In the Sanyo Eco cute system, the device has a bypass line controlled by a solenoid valve which is activated when the defrost cycle is required. It draws the hot CO2 from the outlet of the compressor and releases it at the inlet of the evaporator. In their work at KTH university (Yank Chen et Al., 2008) the characteristics of defrost cycle on the Sanyo Eco Cute system has been studied. They noticed in particular that 2 temperature sensors are used at the inlet and outlet of the evaporator to measure the air temperature difference. When no difference is detected anymore, a defrost cycle is started since it means that no heat transfer occurs anymore. The energy used for the old version of the system is about 1.7kW for 10 min.
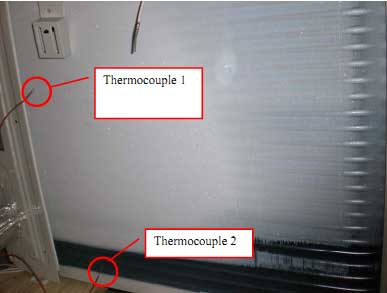
Evaporator before the defrost cycle(Yank Chen et Al., 2008)
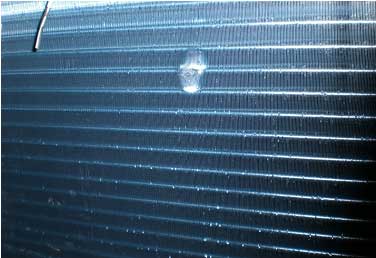
Evaporator after the defrost cycle (Yank Chen et Al., 2008)
Understanding the defrost cycle
The characteristics of the defrost cycle and its impact on the heat pump performances will depend on many parameters:
- Some external parameters: outside temperature and humidity of the air
- The state of the system: how hard the heat pump works. It can be represented by the power consumption of the compressor.
- The evaporator design: size and shape of the evaporator
- The controls of the system: how the system detects the ice on the pipes and activate the defrost cycle.
Considering the Sanyo Eco Cute System, the design and control of the system are fixed. Then, the impact of the defrost cycle over the system performances should depend mainly on the outside temperature, the humidity of the air and the power consumption of the heat pump.
Some studies have already been undertaken to study the influence of different parameters over the defrost cycle (Yi-Guang Chen et Al., 2009). With their study on frost growth, Xian-Min Guo et al. (2007) show that the formation of the ice is not a simple phenomenon to model and analyse. In particular:
- The air temperature and humidity are the 2 mains parameters which determine the ice formation.
- 3 main steps can be noticed during the ice formation with different ice growth characteristics.
- In function of the conditions of formation the layer of ice will be more or less dense.
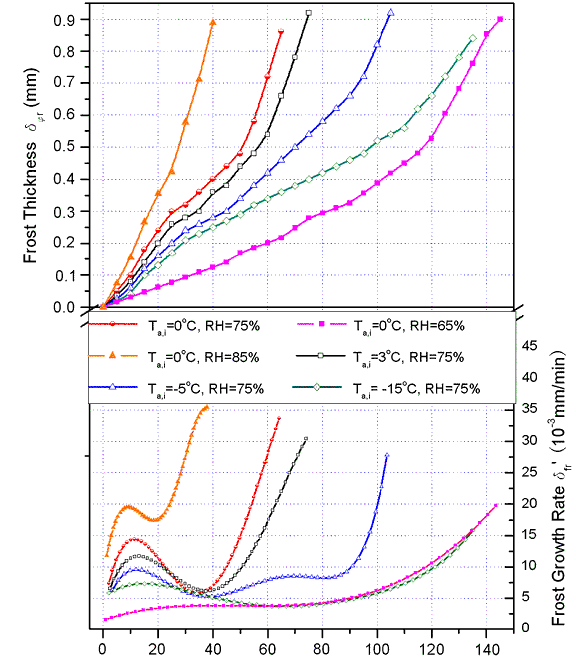
Variation of the frost thickness and frost growth with time for different air temperature and relative humidity
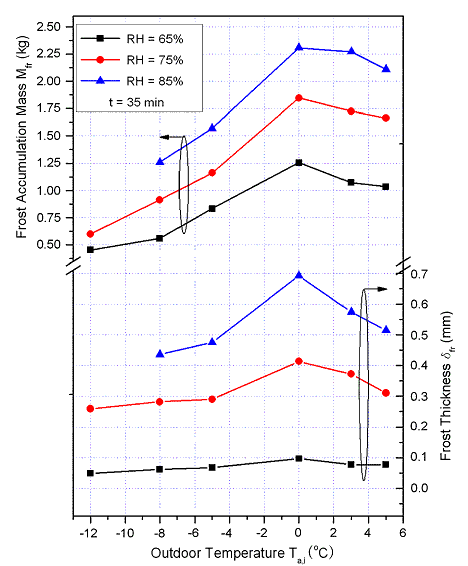
Frost accumulation Mass and frost thickness in function of the outside air temperature and relative humidity
It is clear with the graph presented above that both temperature and relative humidity of the air have an impact over the ice formation on the evaporator. It can be noticed that, at constant temperature, the higher the relative humidity of the air, the faster the frost formation will be. In opposition, at constant relative humidity, the lower the temperature (below zero), the less ice will form on the pipe. The air can hold indeed less water at low temperature than at higher temperatures. However if the temperature is too high, the condensed water won’t freeze on the pipes. There is thus a temperature around 0 which tend to maximize the ice formation.
On the curves about the frost growth formation, different steps in the ice formation are noticeable with different growth rate. The formation of the ice is not indeed uniform and these different steps are described in the paper of Xian-Min Guo et al. In addition, it can be noticed that in function of the frost growth, the actual mass of the ice formed on the evaporator is not always the same. The faster the ice crystals are formed over the pipe, the bigger and the less ordered they will be. It is then important to notice that the frost mass will determine the energy required to make the ice melt down and the frost thickness will determine the length of the ice formation before the obstruction of the evaporator.
The formation of the ice on the evaporator is a matter of psychometric and heat transfer between the air and the refrigerant in the pipes by convection. The temperature of the air and the relative humidity are probably not homogeneous in the evaporator. The ice formation is also not fundamentally easy to model since the ice crystals will be different in function of the conditions of formations.
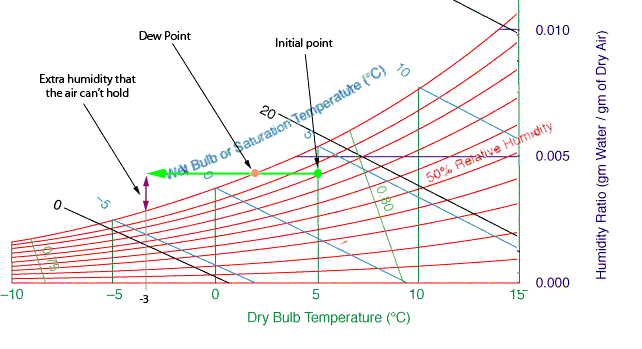
Considering a psychometric chart, it is however possible to do some basic assumptions in order to study the frost formations (diagram below). The air contains a certain amount of humidity in function of its temperature and its relative humidity (initial point in the diagram). When the air is cool down below the dew point the absolute humidity content stay the same as long as the air can hold the humidity. Actually after reaching the dew point, the extra humidity that the air can’t hold will condense and freeze on the pipes if the temperature is below 0°C.
If the heat pump is operating at a constant power, the temperature difference between the air and the evaporator will be sensibly similar. The air won’t get out of the evaporator at the pipes temperature of the evaporator but at a higher temperature. The temperature difference between the air at the inlet of the evaporator and the refrigerant temperature in the evaporator is in general about 8 or 9°C (KTH report).
In order to make a small study with the psychometric chart, it can be assumed that the temperature difference is about 6°C in order to study the shape of the curves. The psychometric chart can be used to calculate in different conditions the extra moisture which is likely to condense and freeze on the pipes if the temperatures are sufficiently low. Considering a constant air mass flow from the fan of the evaporator, it can be assumed that the time of ice formation between each defrost cycle will be inversely proportional to the amount of moisture freezing on the pipes. Using a simple psychometric calculator, the inverse of the extra moisture can be calculated in function of the outside temperature for different relative humidity levels (graph below).
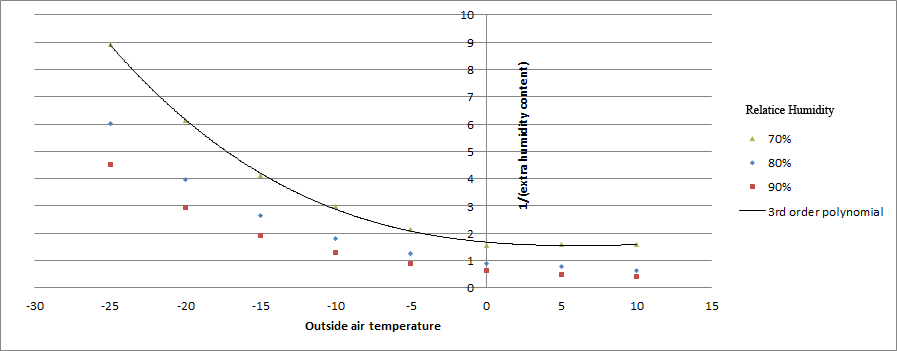
Simple model: inverse of the extra moisture content in function of the outside temperature for different relative humidity levels
(for a drop of temperature of 6 degree Celsius)
This graph gives an idea of the time variations of the frost formation in function of the outside temperature and and for different relative humidity level. The previous trend are confirmed by this simple analyses.
Data from the Finnish case study
Even if the COP measurement on the Finnish installation were not totally accurate from the beginning, it is not problematic for the study of the defrost cycles. Only the start and stop of the compressor and its electrical consumption along with the relative humidity and temperature of the outside air are required to realize the analysis.
The variations of the defrost cycles in function of the outside air temperature and relative humidity are illustrated on the following graph.
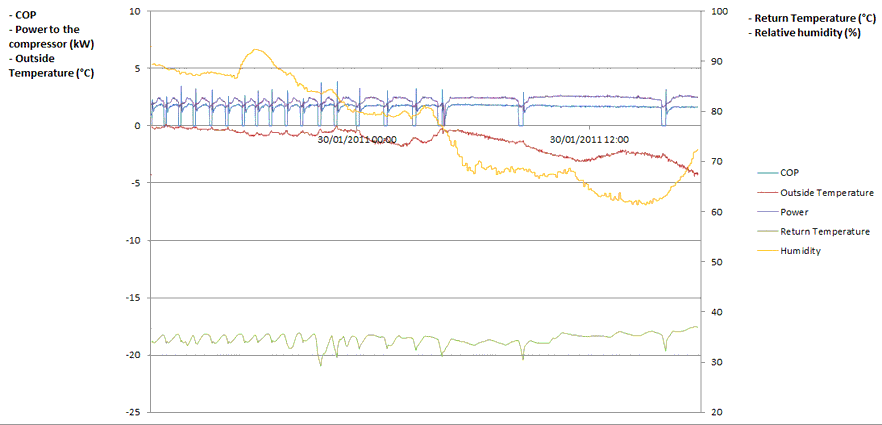
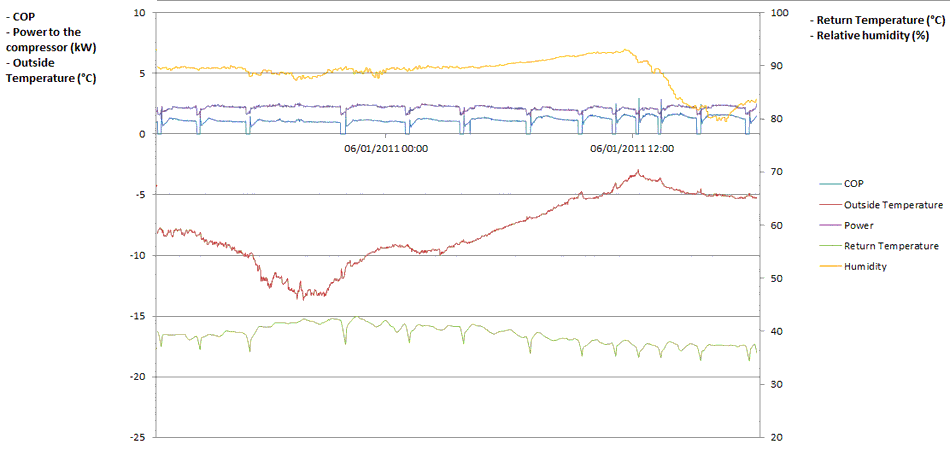
Monitoring of the Finnish installation highlighting the fluctuations of the defrost cycles frequency in function of the outside temperature and relative humidity
At constant temperature, a drop in humidity decreases the frequency of the defrost cycle. At constant humidity, a drop of temperature also decreases the frequency of the defrost cycle. Above 6°C, there are no defrost cycle since the water condensing can’t freeze around the pipes.
The study of the defrost cycles has been made for the months of October and January. For each of these months, the time required to form the ice has been calculated for each defrost cycle. Over the same period, the mean outside temperature and relative humidity are calculated. When the temperature was exceeding 7 degree Celsius, there was no defrost cycle considered. When the heat pump was stopped, the ice was considered to be staying if the temperature was below 0°C. For the two months, a total of 1095 defrost cycles are finally considered after suppression of the points which were obviously inaccurate.
The results of this analysis are presented on the following graph with the time of the ice formation in function of the air temperature and relative humidity. The energy required for each defrost cycle in function of the time of formation of the frost is also drawn.
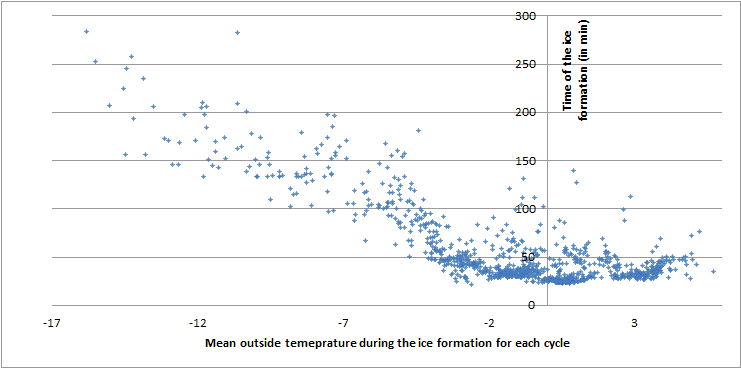
Time of the ice formation in function of the mean air temperature
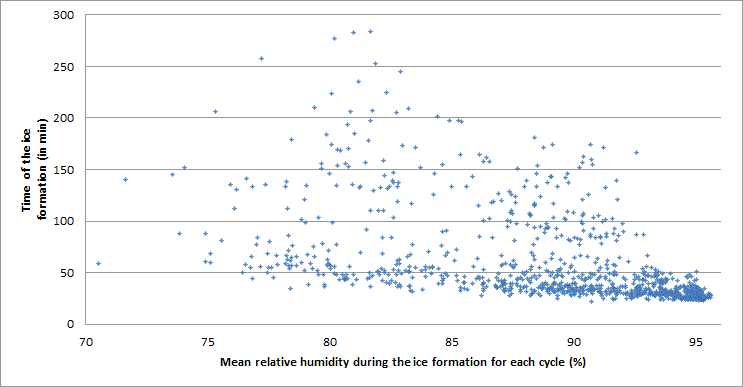
Time of the ice formation in function of the mean air relative humidity
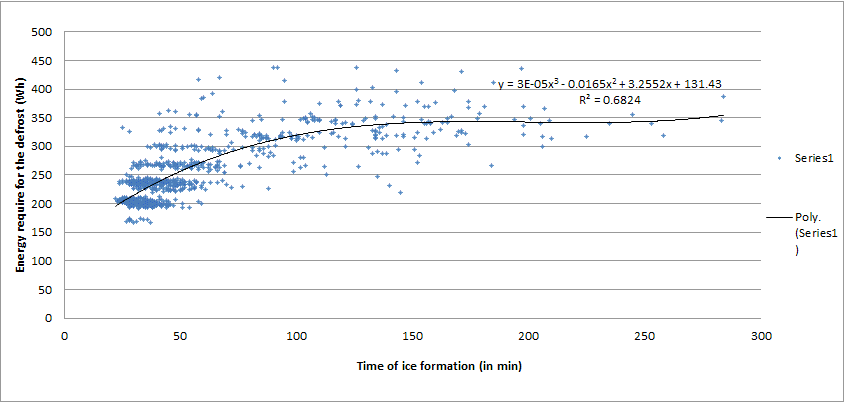
Energy required for the defrost in function of the time of ice formation
Analysis of the data from the Finnish installation
The monitoring data from the Finnish installation confirm the influence of the outside temperature and the relative humidity over the characteristics of the defrost cycles. In particular the trends for the time of frost formation is quite similar to the one noticed previously with the simple psychometric analysis, except for low outside temperatures where the experimental curve doesn't seem to keep an exponential trend. However, the simple analysis doesn't include the dynamics of the ice formation.
With the data that we collected, it is possible to do a regression of the time of the ice formation in function of the outside air temperature and the relative humidity. The parameters have been chosen in order to optimize the coefficient of correlation (table below).
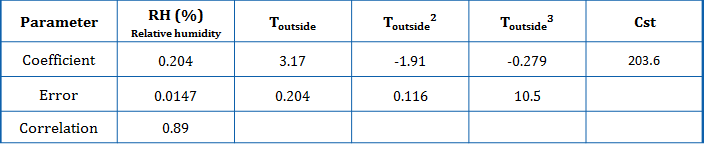
Regression for the time of the ice formation (min)
The regression is not totally accurate but enable to have an first approximation of the time of frost formation. this expression becomes probably less accurate at low temperature where there are less data available for the regression. However in the context of the UK climate where the temperatures are quite mild, it should be too problematic.
It is also possible to find a rough expression of the energy required for each defrost cycle in function of the time for the frost formation (it seems indeed to be the main determinant parameter). The regression of the curve with the coefficient found is presented directly on the graph above. It is however necessary to highlighted that it is the energy required for the small heat pump of 4.5kW.
Conclusion on the defrost cycles
A simple model is suggested for the defrost cycles of the Sanyo CO2 heat pump. When the temperature is above 6°C the defrost cycles should be considered. The time of ice formation can be calculated with the previous regression in function of the outside temperature and relative humidity. The power required for the defrost can then be estimated in function of the time of ice formation. However the model has not been validated and these results should be used with precaution.
Bibliography
1. Xian-Min Guo et Al., Experimental study on frost growth and dynamic performance of air source heat pump system. 11 April 2007. Available online: here
2. Yi-Guang Chen, Xian-min Guo, Dynamic defrosting characteristics of air source heat pump and effects of outdoor air parameters on defrost cycle performance, 2009. Available online on Science Direct
3. Yank Chen et Al., CO2 Heat Pump for the Swedish market – Test and analysis of the Sanyo Eco-Cute heat Pump modified for Swedish conditions. 2008, KTH University , Energy technology, lab of Division of Applied Thermodynamics and Refrigeration. Available online at http://effsysplus.se/wp-content/filesystem/tidigare_program/effsys2/Publicerade%20dokument/P03/P3%20slutrapport.pdf