


EES Model

1. Introduction to EES
EES stands for Engineering Equation Solver. Its basic function is to provide the solution to a set of algebraic equations. EES can solve differential equations and equations that have complex variables. It also has the ability to undertake optimization with regards to the data and has a function that will allow data to be plotted onto graphs. The software contains a large number of mathematical and thermo physical functions built into it. Steam tables, air tables, refrigerant properties, psychometric functions are also built in and by using any two properties at any one point; other thermodynamic properties can be calculated. More information on EES
A model of the CO2 heat pump is made in EES by assuming some parameters and using the exact characteristics of the Sanyo heat Pump known as ECO CUTE (Model Number SHP C90GDN). The basic purpose of the model is to understand effects of different parameters on the efficiency of the heat pump and in doing so calculate the (COP) for these different parameters.
2. Model Description:
The Sanyo Eco cute uses a split cycle and it contains a 2 stage rotary compressor with inter cooling. The mass flow rate is different for each of the different components of the heat pump. During our monitoring process we were unable to measure the mass flow rates in the system which then made the modelling of this cycle quite difficult. The pressure before and after inter cooling could not be measured from the inside of the system. Dealing with different mathematical equations in this case was resulting in a higher number of unknowns compared to the number of equations. Due to all these problems, a simple model was assumed. The model includes evaporator, two stage rotary compressor, gas cooler and expansion valve. In order to avoid the errors of assumptions, the compressor was considered as a whole, eliminating the inter cooling between stages and just considering its inlet and outlet conditions. Monitoring results from a report published in 2002 prepared for the Air conditioning and refrigeration technology institute under ARTI 21-CR program contract number 611-10070 provided us with the opportunity to use the actual data from the performance of a Sanyo compressor C-CV113H0W used in the eco cute heat pump. The cycle shown in figure 1 is the simple cycle. The cycle processes are 4-1=Evaporator, 1-2 =Compressor, 2-3= Gas cooler and 3-4=Expansion valve.
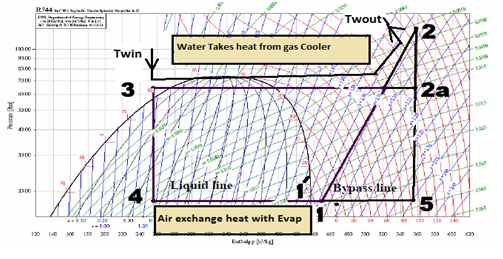
Figure 1: Process cycle shown in logarithmic pressure-enthalpy diagram
2.1 Basic assumptions:
The ambient temperature, water inlet temperature to the heat pump and degree of superheat (14.7 K) before entering the compressor were assumed in the model. The heat exchangers in the evaporator and gas cooler are also assumed to provide a temperature difference of 6oC on evaporator side and 4oC on the gas cooler side.
2.2 Evaporator:
Capacity of evaporator is given by:
The refrigerant is superheated from point 1' to 1 and a degree of super heating was assumed to be 14.7 K.
2.3 Compressor:
In the model, two stage rotary compressor was considered as a whole, inlet and outlet at point 1 and 2 respectively have a single mass flow so the Compressor power is given by
The theoretical volume flow rate can be given as:
Where n is actual speed of compressor in rpm, Vdispl is displacement volume of compressor.60. 10-6 is used for unit conversion of displacement volume from cm3 to m3/h. For two stage hermetic compressor of Sanyo it has a displacement volume of 3.33 cm3 (1st stage) and speed was assumed to be 4800 rpm.
Volumetric efficiency of compressor is given as below:
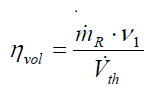
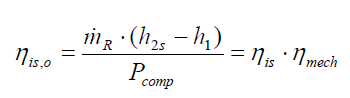
Here v1 is the specific volume of refrigerant at the entrance to the compressor and Isentropic efficiency of the compressor is given by:
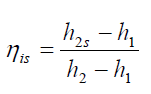
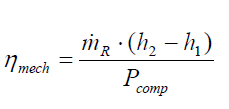
Where the point 2 is the compressor outlet and point 1 shows compressor inlet state. Due to friction and heat losses the mechanical efficiency of compressor was also considered and is given by:
So the overall isentropic efficiency can be given by:
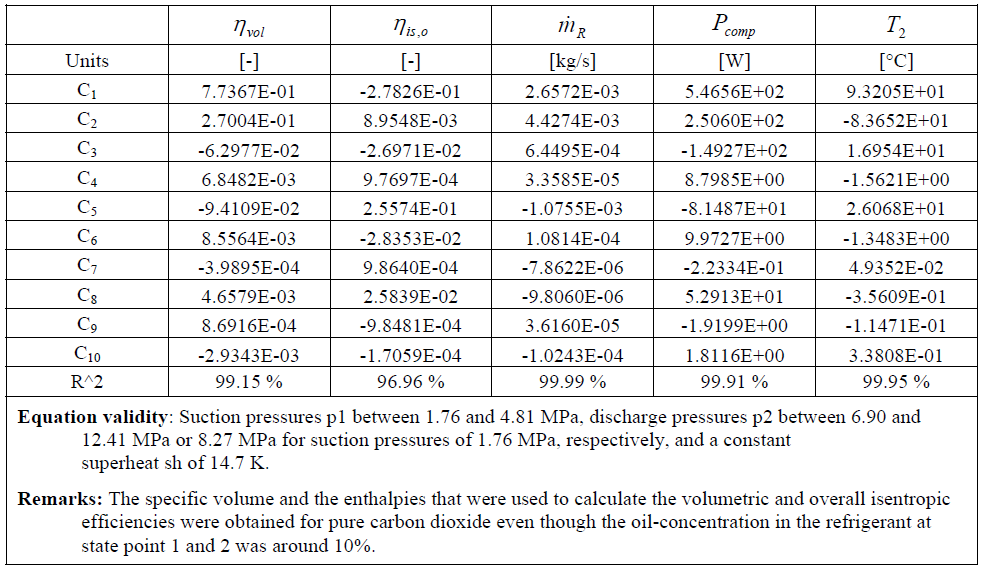
For simplification of the model, volumetric efficiency, overall isentropic efficiency and mass flow rate in the cycle were taken from a map generated by fitting 3 degree polynomial equations at a constant degree of superheat of 14.7 K in performance report of compressor where:
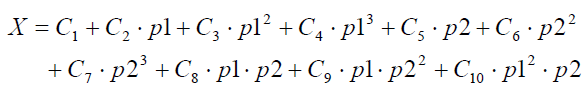
The coefficient for the constants are taken from the table given below
2.4 Gas Cooler:
Gas cooler capacity is given by equation below
COP of heat pump is calculated as:
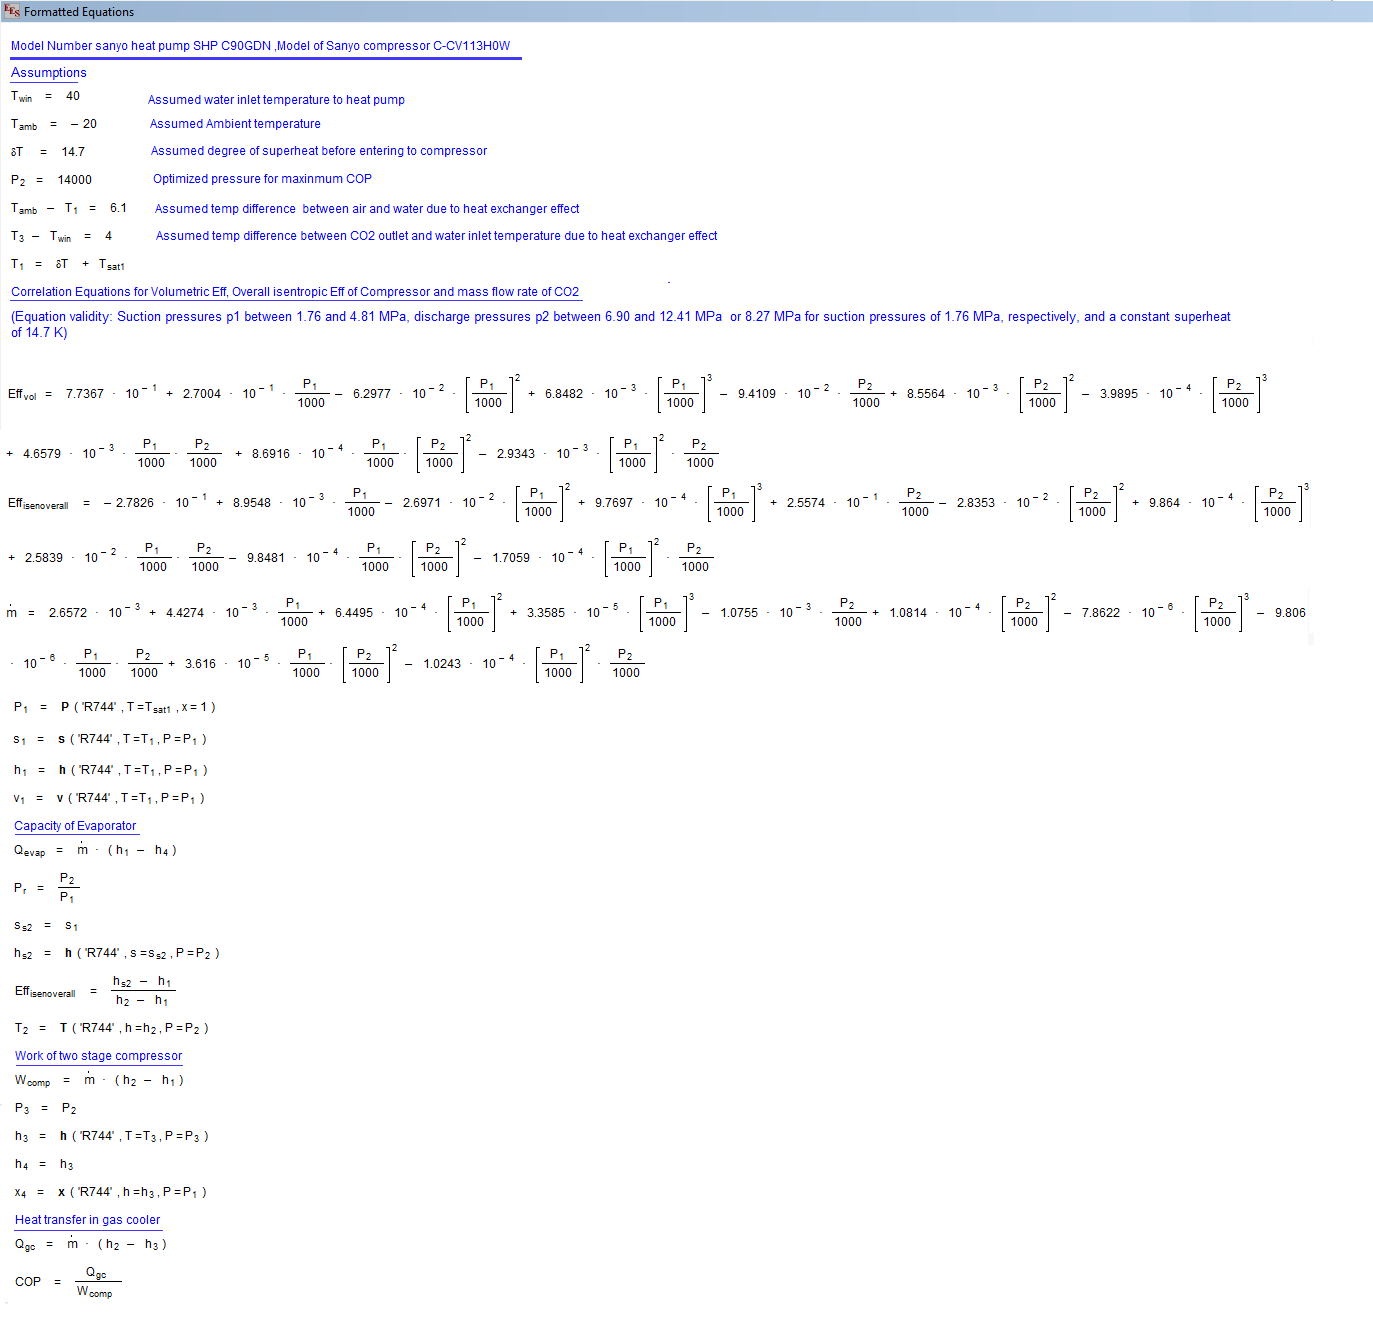
The model in EES is shown in figure below
3. Results of Model
3.1 Model Checking:
a) Comparison with data given in Sanyo Eco cute Servicing Manual:
The model was tested by using the data given in Sanyo Eco cute heat pump servicing manual. A graph below is made to show the comparison between COP given in servicing manual and COP obtained by results of the model made in EES using similar conditions of water return temperature and ambient temperature given in the manual. Comparison is shown in figure below but with a small error.
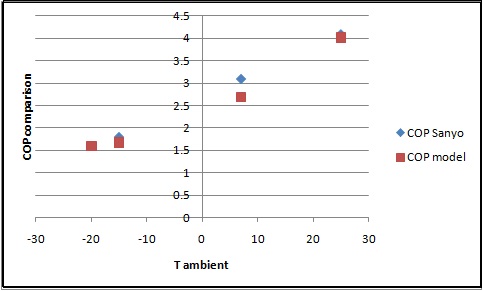
Figure 2: Comparison of COP obtained from Sanyo manual and EES model made
b) Model comparison with Swedish Report:
The model was also tested by using the data given in Swedish Report which describes the testing work of Sanyo Eco cute. The plots were made by using a model in EES at different water inlet temperatures and ambient temperatures. The results were compared with the results given in Swedish report and shown below. We can see the trends of the curve are more or less the same with some small errors.
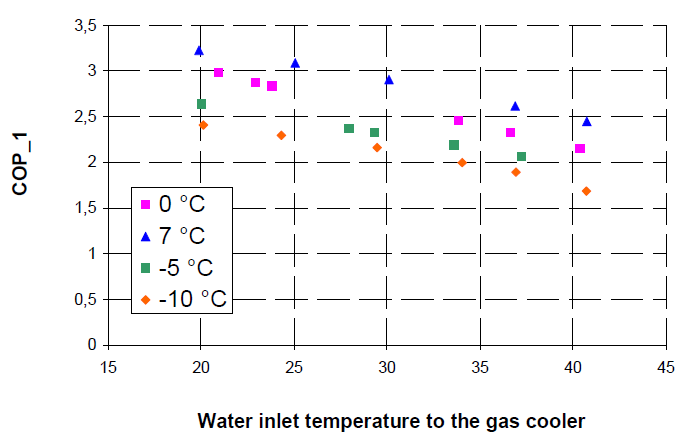
Figure 3: Trend of COP with varying water inlet temperature given in Swedish Report
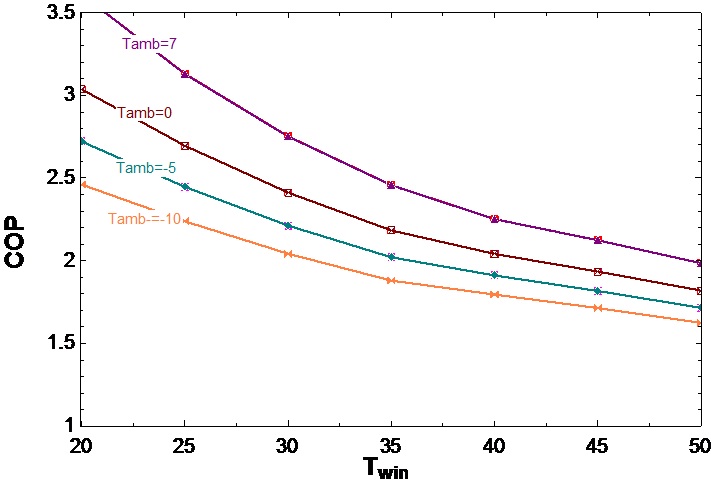
Figure 4: Trend of COP with varying inlet water temperature given by EES model results
c) Reasons of errors obtained in above comparison:
The possible reasons for the errors can be errors in the assumption of the heat exchangers effectiveness on the evaporator and Gas cooler side. If exact model of heat exchangers would be developed by using exact characteristics of the heat exchangers used in Sanyo Eco cute then results could be more accurate. Secondly, Split cycle was not considered in the model for purpose of simplification which had to deal with different mass flow rates in different components of the heat pump. Split cycle of refrigeration for the Sanyo Eco cute also has internal heat exchangers which were not considered here. So if the split cycle effect was considered then errors could be reduced further.
Finally, the compressor was considered as a single unit. Although results were obtained from actual monitoring the inter cooling and intermediate pressures considerations if used in the model could make the model more accurate.
3.2 Relationship in different parameters using plots in EES
Some relationships are drawn by using EES software and the model described above in figures 5 to 12. The COP curve as a function of discharge pressure is shown in figure 5. As discharge pressure increases, COP also increases up to a certain point after which it becomes constant. At certain pressures which are known as optimised pressures, COP is maximum. COP increases with discharge temperature as well, which is shown in figure 6. Figure 7 shows the direct relationship between COP and Ambient temperature and Figure 8 shows mass flow rate increases with increase in inlet pressure of CO2 in compressor. Figure 9 shows the relationship between inlet water temperature to gas cooler at different isentropic efficiencies which show that at a higher isentropic efficiency for the compressor, COP is higher for a given water inlet temperature to the gas cooler. In figure 10, it is visible that if ambient temperature is higher, COP is more for the given water inlet temperature to the gas cooler. Figure 11 reveals that if inlet pressure to the gas cooler is higher slightly lower pressure ratio of the compressor is required to maintain teh same COP. In figure 12, relationship between gas cooler capacity and water inlet temperature is shown, this highlights that if water inlet temperature to gas cooler increases, gas cooler capacity is decreased.
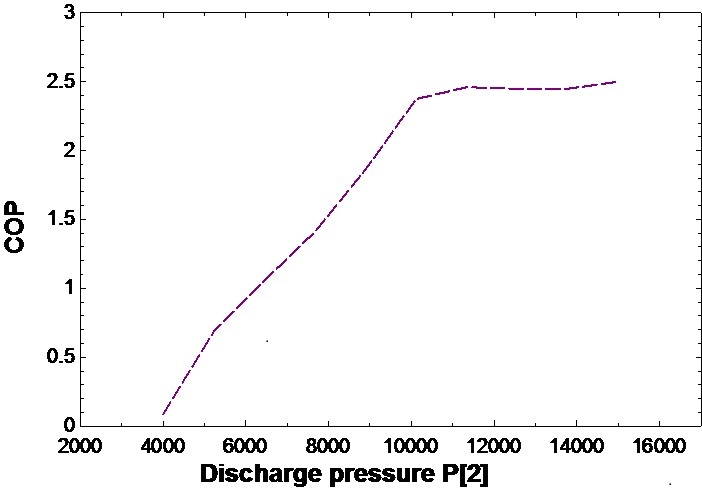
Figure 5: COP versus Discharge pressure
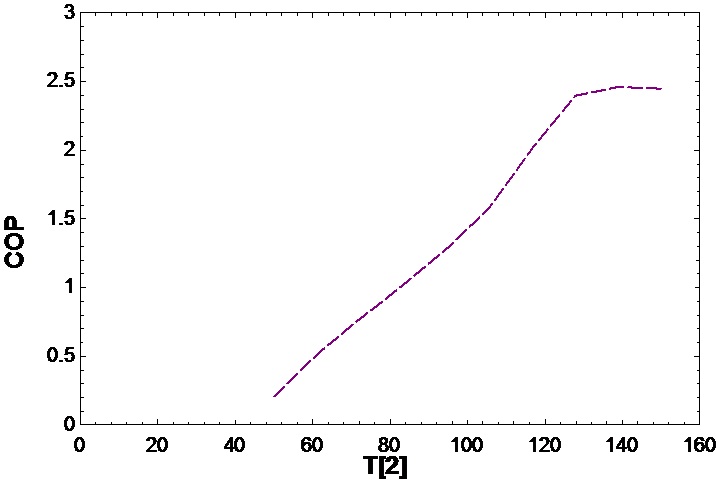
Figure 6: COP versus Outlet temperature of compressor
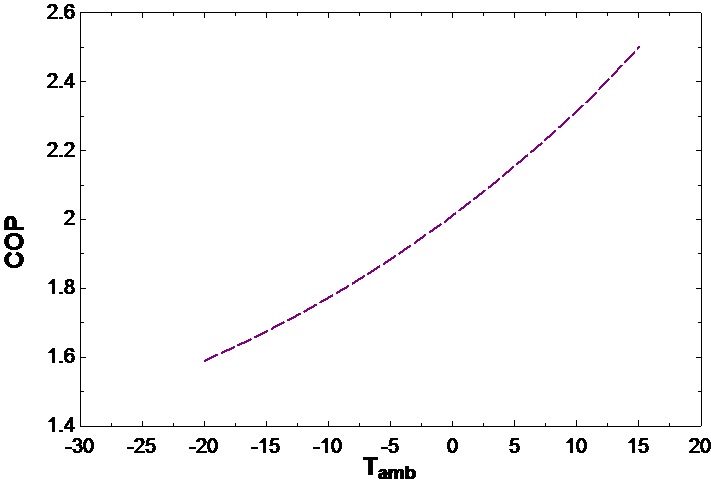
Figure7: COP versus Ambient temperature
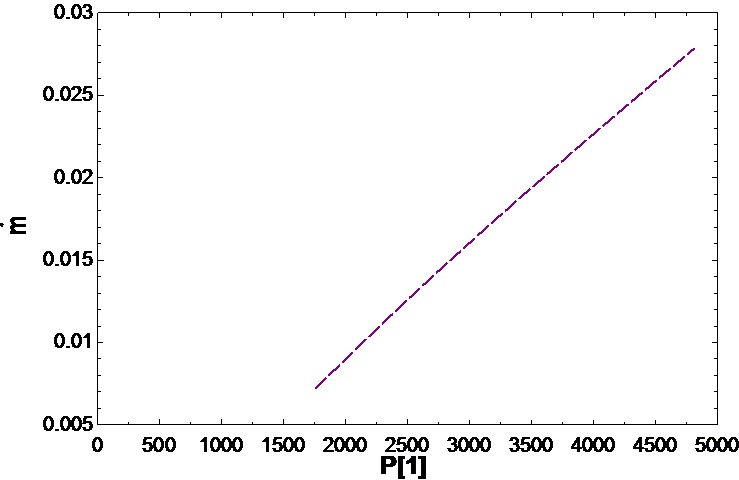
Figure 8: Mass flow rate versus inlet pressure
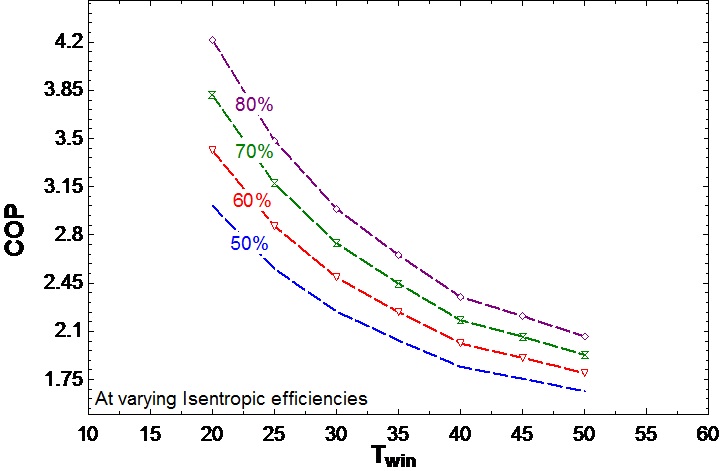
Figure 9: COP as function of water inlet to gas cooler where isentropic efficiency varies from 0.5 to 0.8
Figure 10: COP as a function of water inlet temperature to gas cooler where ambient temperature varies -10 to 7 degrees
Figure 11: Pressure ratio versus inlet pressure of CO2 in compressor
Figure 12: Gas cooler capacity versus water inlet temperature to gas cooler
Bibliography
1. Chen, Y., Lundqvist, P., Alves, A., and Brachert, L. , CO2 heat pumps for the Swedish market :Test and analysis of the SANYO ECO-CUTE heat pump modified for Swedish conditions http://effsysplus.se/wp-content/filesystem/tidigare_program/effsys2/Publicerade%20dokument/P03/P3%20slutrapport.pdf
2. EES: Engineering Equation Solver for Microsoft Windows Operating Systems (Commercial and Professional Version) http://www.me.mtu.edu/~jstallen/courses/MEEM3220/EES_manual.pdf
4. Hubacher, B. and Groll, E.A., 2002. MEASUREMENT OF PERFORMANCE OF CARBON DIOXIDE COMPRESSORS ARTI-21CR/611-10070-01 Final report. Indiana: Ray W. Herrick Laboratories
5. Sanyo Technical Manual for Servicing http://www.essaircon.com/products/LF344-CO2-Full-Tech.pdf