

| Maximum Storage Strategy |  |
The second scenario focused on maximising the installed capacity of MCTs, which uses the maximum the level of pumped storage available. Thus producing a maximised baseload supply strategy that selected the maximum number of MCT units that could be installed at each site selected.
Energy analysis results Economic analysis Socio-economic analysis
Emissions analysis Environmental impact analysis
Energy analysis results
- First Generation Scheme
- Scheme Size
- Power profile using mean tidal speeds
- Variation in power profile during spring and neap tides
- Summary of results
- Second generation schemes
- scheme size
- Power profile using mean tidal speeds
- Variations in power profile during spring and neap tides
- Summary of results
| Location | No of units | Installed capacity (MW) |
| Islay, South of Orsay | 389 | 389 |
| Kyle of Rhea | 32 | 32 |
| Pentland Firth, Inner Sound | 211 | 211 |
| Pentland Firth, South Ronaldsay | 65 | 65 |
| Pentland Firth, South of Skerries | 32 | 32 |
| Pentland Firth, North of Skerries | 32 | 32 |
| Kintyre, South of Mull | 175 | 175 |
| Total | 936 | 936 |
back to top
The graph below show the total varying power output (157 - 694 MW) for a day, for the maximum number of units on each of the different locations. The resulting baseload of 444.8 MW together with the pumping and generation cycles are shown in the proceeding graph.
back to top
The nature of the total varying power output for springs and neaps are shown as below with the corresponding pumping and generating cycles of the pumped storage plant to achieve a baseload. The baseload for spring and neap tides was found to be 532.6 and 268.4 MW respectively which is higher than the first strategy but with correspondingly higher energy lost of 4.6 and 10.5 %.
Power profiles using mean spring tidal speeds
Power profiles using mean neap tidal speeds
back to top
The summary results are as shown below. In this case 936 units resulted in an annual energy yield (AEY) of 3508.4 GWhr and a higher capacity factor of 0.43 since the full capacity of high speed locations was exploited. However there was a greater need for storage to level of the peaks and troughs, 33.5 % for neaps.
| Description | Units | Mean | Spring | Neap |
| No of units | 936 | 936 | 936 | |
| Installed capacity | MW | 936 | 936 | 936 |
| Range of varying power output | MW | 157 - 694 | 258 - 756 | 32 - 506 |
| Baseload | MW | 444.8 | 532.6 | 268.4 |
| Daily energy lost | MWhr | 700.6 | 612.8 | 720.6 |
| Percentage energy lost | % | 6.2 | 4.6 | 10.1 |
| Daily energy stored | mwhr | 2327.0 | 2036.1 | 2401.8 |
| Percentage of energy stored | % | 20.5 | 15.2 | 33.5 |
| Percentage of cruachan used | % | 26.4 | 23.1 | 27.3 |
| Annual energy | GWhr | 3508.4 | ||
| Power factor | 0.43 | |||
| Location | No of units | Installed capacity (MW) | ||
| Islay, south of orsay | 519 | 519 | ||
| Kyle of Rhea | 48 | 48 | ||
| Pentland Firth, Inner Sound | 211 | 211 | ||
| Pentland Firth, South Ronaldsay | 244 | 244 | ||
| Pentland Firth, South of Skerries | 259 | 259 | ||
| Pentland Firth, North of Skerries | 133 | 133 | ||
| Kintyre, South of Mull | 354 | 354 | ||
| Total | 1768 | 1768 | ||
The graphs below show the total varying power output (311 - 1446 MW) for a day, for the maximum number of units on the seven locations. The resulting baseload of 881 MW together with the pumping and generation cycles are shown in the proceeding graph.
back to top
The graphs below show the power profiles for each site and the resulting total varying power output during springs and neaps. A higher baseload of 1050 MW was produced during springs and a lower baseload of 468.5 for neaps representing a 55 % drop.
Power profile using mean spring tidal speeds
power profile using mean neap tidal speeds
back to top
The summary results are as shown below. In this case 1768 units resulted in an annual energy yield (AEY) of 6651 GWhr and a higher capacity factor of 0.43. However the power needed to fill in the gaps during a few hours of the day exceeded 400 MW, the rating of Cruachan pumped storage plant.
| Description | Units | Mean | Spring | Neap |
| No of units | 1768 | 1768 | 1768 | Installed capacity | MW | 1768 | 1768 | 1768 |
| Range of varying power output | MW | 311 - 1446 | 521 - 1587 | 61 - 960 |
| Baseload | MW | 881.0 | 1050.0 | 468.5 |
| Daily energy lost | MWhr | 1340.6 | 1214.1 | 1220.5 |
| Percentage energy lost | % | 6.0 | 4.6 | 9.8 |
| Daily energy stored | MWhr | 4463.43 | 4035.83 | 4058.5 |
| Percentage of energy stored | % | 19.9 | 15.3 | 32.6 |
| Percentage of Cruachan used | % | 50.7 | 45.9 | 46.1 |
| Annual energy | GWhr | 6651.0 | ||
| power factor | 0.43 | |||
Economic analysis
The cost of electricity with such an installation is shown for the first 14 years below:
This is based on the assumption of a loan for each year of installation, taken out at the start of each installation year, plus annual costs and pumped storage costs. The yearly loan repayments, for the total expenditure of £925,000,000 are shown below (£):

For an explanation of the economic calculation, click here
back to top
Socio-economic analysis
The job potential as a result of this strategy is shown in the graph below :

For an explanation of the socio-economic calculation, click here
back to top
Emissions analysis
The following table shows the emissions saved by using marine current energy instead of conventional thermal power, at the first and second generation stages:
Note: These figures are estimates based on average emission values from several sources. No distinction is made for generation using specific pollution abatement technologies etc.
For an explanation of the emissions calculation, click here
back to top
Environmental impact analysis
This second strategy, opting for the maximum number of units that could be installed in each site, thus maximising the storage required, would result in maximum environmental impact.
The number of units installed at each site compared to the total area of seabed, considered available for installation of the turbines in the Site Analysis phase, can give an indication of the level of impact that would be experienced:
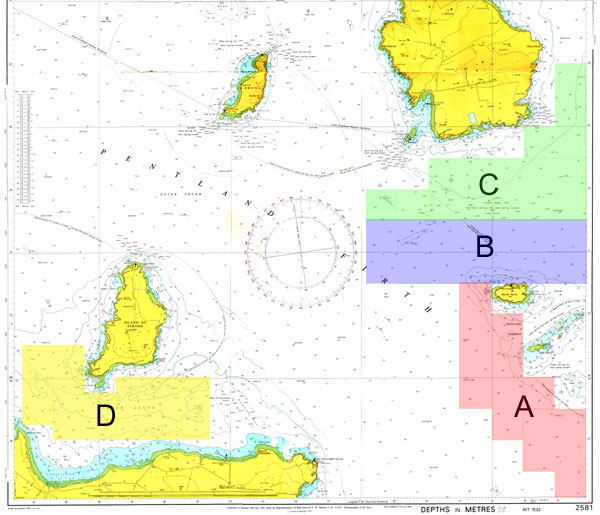
Figure: Selected Farm size area for sites located in the Pentland Firth, Admiralty Chart 2581.
Pentland Firth, South of Skerries
259 MCT units would be installed out of a maximum possible 260 units. This means that almost all of the 14.8 km2 area would be developed and experience maximum impact on fish, mammals and other wildlife which live or migrate through these waters (see site area A on the map of the Pentland Firth above). This site is classed as a high collision risk area (experiencing over 5 vessels per day [1]) therefore permanent exclusion zones would be positioned around the farm to prevent vessels entering. This strategy would not install any units in the waters between Duncansby Head and the Skerries sites. Therefore all commercial traffic e.g. tankers travelling to and from Scapa Flow oil terminal, could be diverted through this channel. The closest point-of-connection to the transmission network is at Thurso, therefore over 19km of sub-sea cabling would be required which would result in further disruption of the seabed and wildlife due to the digging of trenches and laying of cable.
Pentland Firth, North of Skerries
The maximum number of 133 MCT units would be installed in these waters, resulting in 6.5 km2 of seabed being affected by the installation, construction and operation of the turbines (see site area B on the map of the Pentland Firth above). This site is also classed as a high collision risk area, therefore exclusion zones would be designated to prevent collision with vessels. Again, traffic could be diverted through the channel between Duncansby Head and the Skerries sites. Grid connection would cause similar impacts experienced at the Southern site.
Pentland Firth, South of South Ronaldsay
The full available capacity of 244 MCT units would be installed. 13.9 km2 of seabed would undergo significant impact (see site area C on the map of the Pentland Firth above). These waters are also classed as high navigational-risk as would therefore require navigational buoyage to be laid to warn traffic. Any fishing involving nets, lines of potting would also be prohibited (including the sites around the Skerries and Inner Sound area of Pentland Firth) due to the risk of damage to fishing gear or the turbines. Again, traffic could be diverted through the channel between Duncansby Head and the Skerries sites. Over 20 km of sub-sea cabling would be necessary to connect the farm at this site to the transmission network at Thurso. This would cause significant damage to seabed habitat located close to the path chosen to lay cables.
Pentland Firth, Inner Sound
211 MCT units would be installed in the 12 km2 area resulting in all other users and wildlife operating and living in this area being affected in someway (see site area D on the map of the Pentland Firth above). If alternative routes were required the Outer Sound to the north could be used. The transmission grid is located much closer meaning over 13km of sub-sea cable would be required, therefore less of the sea bed would be effected compared to the sites located further out such as Skerries and South Ronaldsay.
West Scotland, Kyle of Rhea
A total of 48 MCT units would be installed exploiting the total 2.8 km2 area available. Therefore 100% of the area would experience significant impact. As this is a narrow channel between the Isle of Skye and the mainland, careful navigational marking and exclusion zones would be required to allow fishing and recreational vessels to pass through safely. The Kyle of Rhea is designated a Site of Specific Scientific Interest by the SHN. This could prevent monopile structures being drilled into the seabed, therefore alternative second-generation MCT technology, such as the mooring system may have to be used.
West Scotland, Southwest of Orsay, Islay
The maximum number of 519 MCTs would be installed, so the entire 29.6 km2 area, considered suitable for installing the turbines in depths ranging from 20 to 80 metres, would be developed. As this selected area is so vast and an extremely large number of turbines would be installed, the impact to wildlife and fisherman using these waters would be severe.
Kintyre, South of Mull
354 MCTs units would be installed out of a possible 1298, resulting in only 27% of the available area being covered by the MCT farm leaving a large proportion of the seabed unaffected. This would again allow significant room for shipping traffic, fishing vessels, recreational craft and large mammals to navigate safely around the scheme. The site is located close to the coast therefore only 2 to 4km would have to be covered by sub-sea cable. However, the closest connection to the transmission network lies at Carradale, some 100km north. Again, over 100 km of overhead lines would have to be constructed causing massive visual impact along the Kintyre Peninsula (this specific reinforcement is already planned by the utility).
For an explanation of the environmental impact analysis click here
back to top