
Biofuel Use
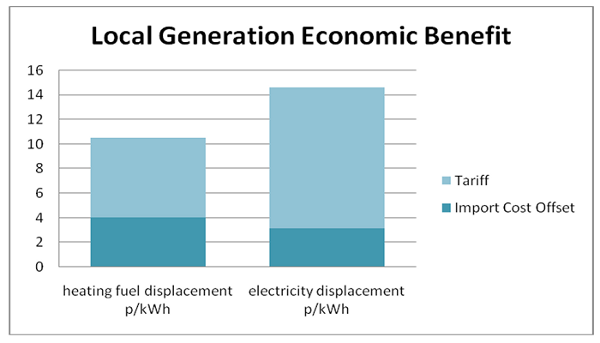
The biogas available can be combusted to provide heat, power, or a combination of the two as outlined in the following section. Some consideration was made of the equivalent value of heat and power. The chart below outlines the relative economic benefits that can be gained per kWh from the biogas at 2010 energy prices with 6.5p/kWh RHI and 11.5p/kWh FIT, assuming the biogas can be burned in a boiler of equivalent efficiency to the existing fuel oil boiler and local electricity generation is at 30% efficiency.
A number of options for fuel use were identified. Biogas production shall vary with the production profile of the distillery, and there is a lack of data available on expected Specific Methane Production rates due to a lack of pilot plant data, so each option was evaluated at a range of SMP’s from 10-15m3/tonne. The fuel use options are outlined below; for more detailed information on the options refer to Appendix B.
- Biogas boiler sized for biogas production to produce steam in parallel with existing oil fired boiler; none of these would be eligible for RHI under current regulations.
- Biogas boiler 200kW to produce steam in parallel with existing oil fired boiler; this would qualify for RHI but excess biogas would require to be flared off to avoid greenhouse gas emissions, or utilised elsewhere.
- Generator sized for biogas production to provide power for the distillery and export to the grid.
- Generator sized for baseload electricity demand of 30kW.
- Co-generation unit production to provide power for the distillery and export to the grid, and to provide parasitic heat load for the AD plant.
- Co-generation unit with steam regeneration.
The co-generation units selected in cases E and F use the same size of prime mover (Internal combustion engine) and generator as in case C. Therefore for a particular biogas production rate, the same amount of electricity would be generated across all three cases. Capital costs were not available for option F, as steam regeneration is rarely economical at this scale; this option is included to illustrate the effect RHI may have on future feasibility of manufacture.
Electrical Demand Matching
Economic and emissions results for power generation will be dependent on whether the electricity is used on-site to offset grid electricity, or exported. The software program ‘Merit’ was used to simulate CHP and generator performance for Balmenach’s demand profile. The methodology is outlined below; further information on Merit is available on the project website.
Demand Matching Methodology:
- Half hourly electrical demand profile for 2010 was constructed (for the limitations of half hourly data, see ‘Assumptions & Sensitivity Analysis’ section).
- Manufacturer’s datasheets were used to construct a database of biogas CHP units for use in Merit (for the limitations of this data, see ‘Assumptions & Sensitivity Analysis’ section).
- Corrected biogas data was constructed to take account of manufacturer’s assumed methane content.
- 6 day and 7 day production cycle demand profiles were identified.
- Part load efficiencies were calculated within Merit.
- Units were sized for 7 day cycles and run at part load for 6 day cycles.