
Assumptions & Sensitivity Analysis
Some areas of uncertainty in our analysis were identified, and the impacts of these along with general assumptions made are outlined below. Data and figures used are detailed in Appendix D.
Electrical Demand Data
The electrical demand data available for the distillery was on a half hourly basis. The results therefore cannot take account of sharp peaks in demand, so although the overall annual electrical demand may be met, there may still be some import of grid electricity to cover demand spikes, resulting in lower than expected economic & emission benefits from generation options. Reducing the amount of electricity generated used on-site by 15% (and adding this to the amount exported) added 3-6 months to the payback periods of electricity generating options.
Biofuel Production Rate
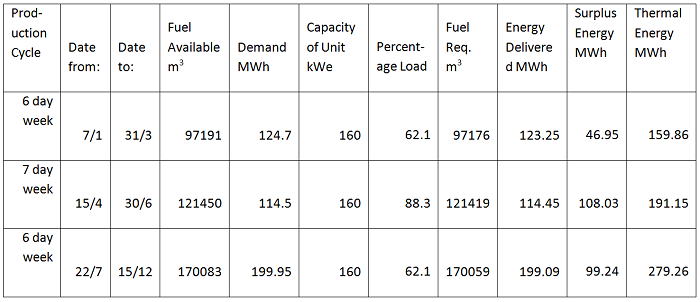
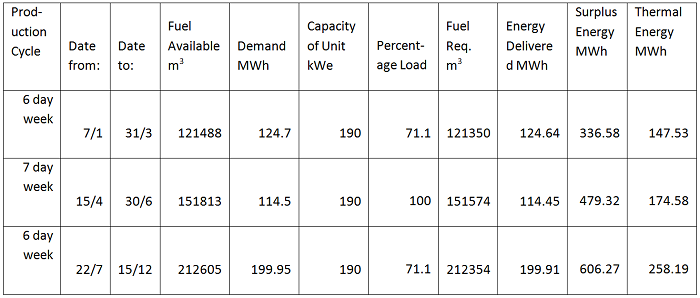
The AD plant is assumed to be able to provide a constant flow of biogas to run the CHP at the level we have recommended. This, however, may not be the case as they are a number of holiday periods when production drops off completely so the production of the biogas may drop significantly. If the level of biogas drops below the 50% load for the CHP then most of the time it will stop operating. If for some reason the methane production levels drop so there is less biogas then the CHP will have to operate at part load or could be set to follow the electric load as this requires less fuel. The best suited capacity and the respective part load percentages for 6 & 7 day operating cycles can be seen in the tables below.
Conversion rate of 10m3/t:
Conversion rate of 12.5m3/t:
Conversion rate of 15m3/t:
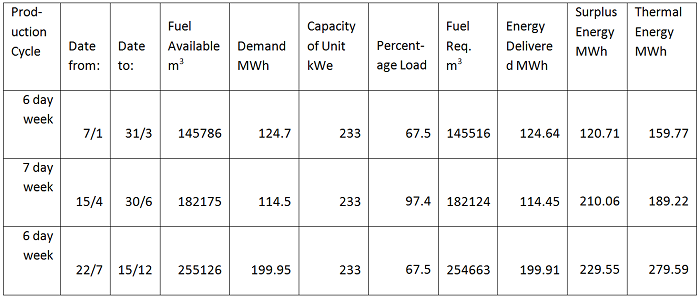
What is apparent in the tables above is that the unit can be sized over 150kWe and should always provide a surplus of electricity to be exported; the financial benefit of this can be found in the results section. This solution also means if the distillery decides to change their production cycle to only 7 day weeks, as was thought to be the case following discussion with the distillery manager, then the CHP will be sized appropriately and should be able to provide even more electricity.
Merit Assumptions
The demand matching calculations used to estimate income from electricity generation options uses manufacturer’s data for efficiencies due to a lack of pilot plant data. These are calculated under standard conditions according to each manufacturer and although some effort has been made to account for different reference conditions, these figures may be expected to over-estimate efficiency over the lifetime of the equipment.
Energy Price Variation
The effect of energy price deviation from the 2010 base case scenario is outlined in the table below:
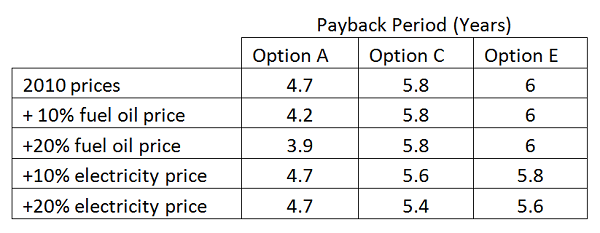
As we would expect, the boiler option (option A) is more sensitive to a rise in fuel prices than the generation options C & E are to electricity prices since a greater part of the benefit is from offsetting import costs as opposed to from tariffs.