To simulate the island’s energy system for each 2030 scenario, in order to determine the optimal supply mix to meet our targets, HOMER pro software was used [11]. HOMER is a microgrid simulation software that calculates the operation of an electrical network over the course of a year in hourly time-steps. It allows various aspects of the energy system to be altered or enhanced and provides several outputs such as time variance graphs for different parameters, and total annual figures for key performance metrics. HOMER allows for multiple aspects and multiple power ratings of those individual aspects to be inputted, and will then calculate what the most cost effective combination is.
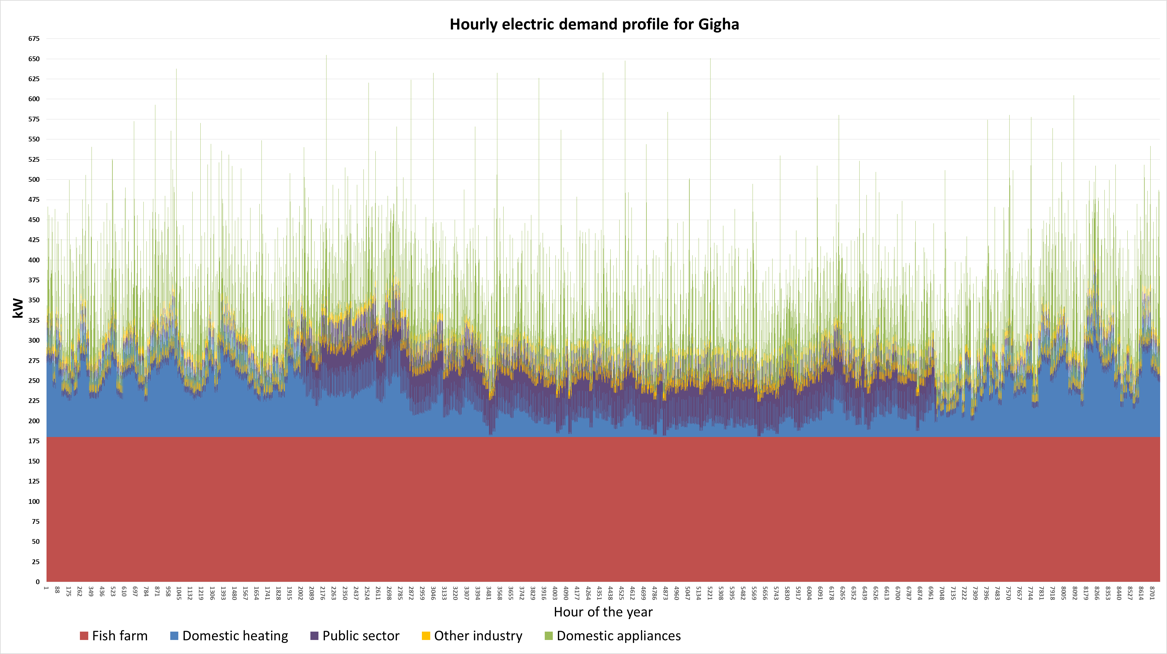
A separate HOMER model for each 2030 scenario was created, using the island’s current energy system as a basis but with the load profile changed to the 2030 profile that was generated for each scenario - an example of which is shown below. Various types and different installed capacities of supply technologies were then added to the model, with storage, and the outputs were viewed and analysed. The time variance line graphs of parameters such as load, total renewables output, state of charge of battery and grid purchases would be observed to ensure the system was functioning as expected. The total annual figures for carbon emissions, grid imports, grid exports and total costs involved would then be viewed and assessed. This would be repeated for each scenario until the most cost-effective energy system that provided an 80% reduction in the carbon footprint, whilst also reducing grid imports was found.
A separate HOMER model for each 2030 scenario was created, using the island’s current energy system as a basis but with the load profile changed to the 2030 profile that was generated for each scenario - an example of which is shown below. Various types and different installed capacities of supply technologies were then added to the model, with storage, and the outputs were viewed and analysed. The time variance line graphs of parameters such as load, total renewables output, state of charge of battery and grid purchases would be observed to ensure the system was functioning as expected. The total annual figures for carbon emissions, grid imports, grid exports and total costs involved would then be viewed and assessed. This would be repeated for each scenario until the most cost-effective energy system that provided an 80% reduction in the carbon footprint, whilst also reducing grid imports was found.