|
Scenario 2 |
|
For scenario 2, where the population of the island has increased to 200, it was found that the target of reducing carbon emissions by 80% while also reducing grid imports, could be met with the same additions to the energy system as in Scenario 1. This is despite the additional demand from extra households of several hundred kWh per day compared to scenario 2. This can be seen in the schematic diagram, where 500kW of PV panels, and 1.05MW of Lithium-Ion batteries have again been added to the islands current energy system.
|

|
|
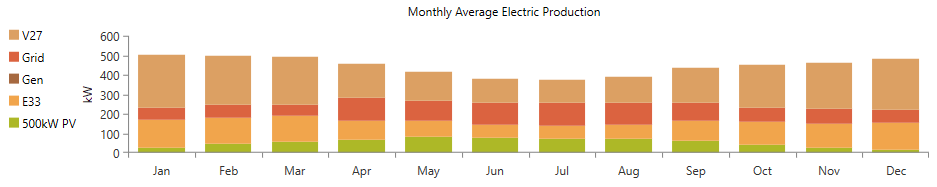
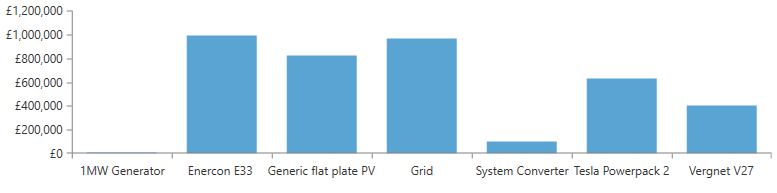
The additional demand being met by the same system means that the island is slightly more dependent on grid imports than in scenario 1. However, the majority of energy consumed and exported on the island is still from renewable sources, as can be seen the electrical production table (right) and graph (above). In this scenario, grid purchases account for an extra 2% of total electrical production compared to scenario 1. This may not seem like a significant amount, however over the course of the year it amounts to almost an extra 200,000 kWh of grid imports. These additional grid imports amount to the biggest difference between scenarios 1 and 2, with the total annual cost of grid purchases increasing to almost £1 million, as shown below. Apart from that, all costs are the same as scenario 1, with the same assumptions being applied.
|

|
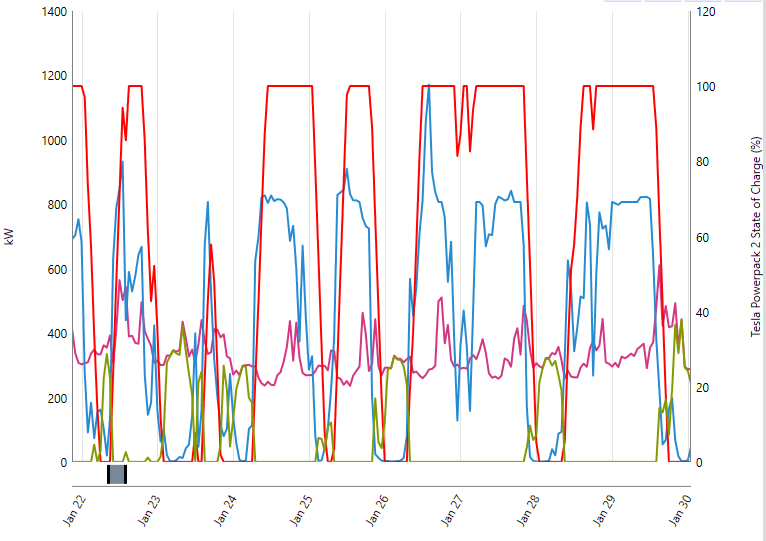
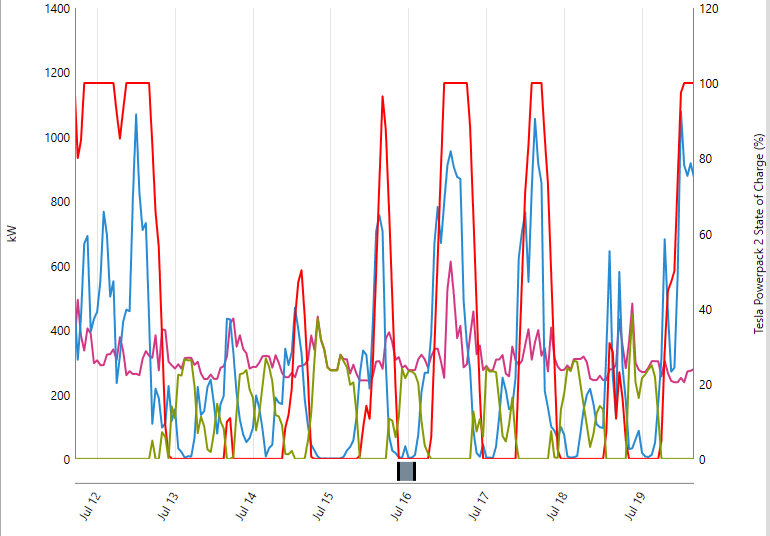
The functioning of the system in a winter (left) and summer (right) week are shown below. As it has the same component parts, the energy system here functions the same as described in the Scenario 1 results.
|
|

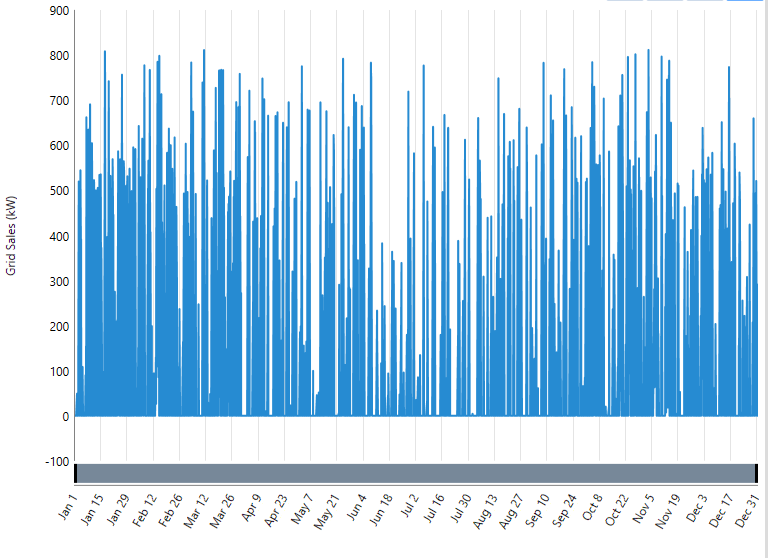
Due to the additional electrical demand, total yearly grid exports are reduced compared to scenario 1. As with scenario 1, grid exports rarely exceed 800kW, so are well within the export limit, as can be seen in the graph at the bottom of the page. To see Scenario 2's carbon footprint, total grid imports and export and economic results, visit the scenario comparison section.