|
Scenario Compariso n |
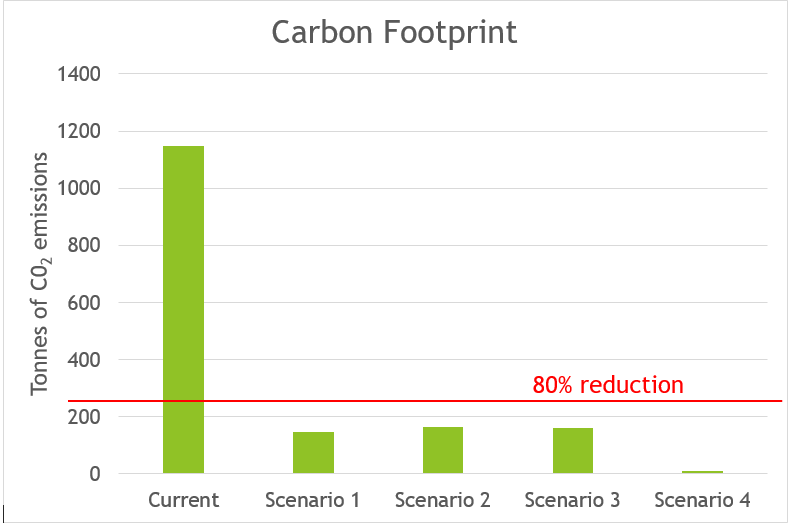
The central target of the project was to produce an energy system for each scenario that would provide a reduction of 80% of the island’s carbon emissions. As shown in the graph below this was achieved for each target. For details on how the current carbon footprint of the island was calculated click here. The carbon reduction was achieved for each scenario through the implementation of heat pumps, additional renewable generation and storage, assumptions that there would be an uptake of EVs on the island, and that the carbon intensity of UK grid electricity would decrease. The government currently estimate that by 2030 the carbon intensity of electricity on the grid will be around 150 g/kWh [5]. For our scenarios we took a more conservative estimate that the intensity would reduce to around 200 g/kWh, in case the expected uptake in renewables on the national scale is not as large as currently predicted. The scenario's carbon footprints were calculated by multiplying the grid purchases on HOMER by the estimated carbon intensity factor of the grid, and adding this to the calculated emissions from non EV cars. For Scenario 4, the island is almost carbon neutral, the small amount of carbon emissions being only from the cars still using petrol and diesel, that had not converted to EVs yet.
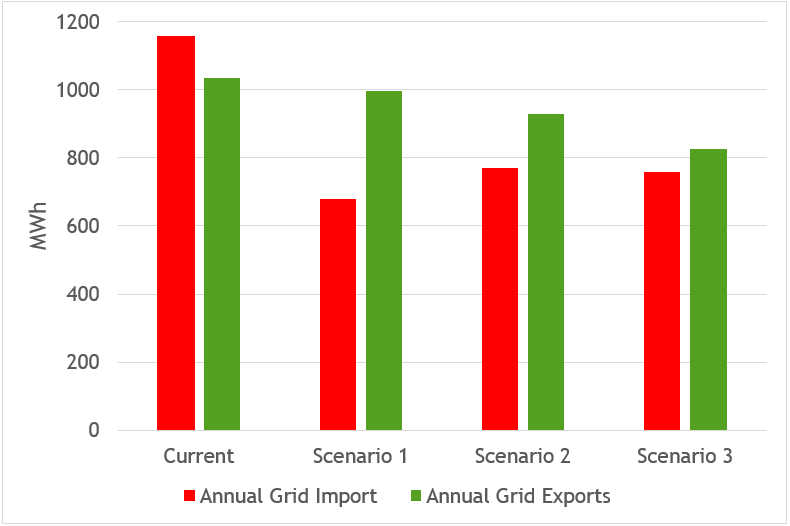
The two graphs below show the total annual grid imports and exports, taken from the HOMER models of each scenario, and the islands current energy system. One of the aims of the project was to reduce grid imports, in order to save the community on the island money, as they are currently charged 12 p/kWh at non peak times, and 18p/kWh at peak times for electricity – which amounts to a significant cost over the course of the year. Grid exports were attempted to be kept as high as possible, within the export limit, as the island receives money per kWh exported to the grid. The graph below shows how the island is currently a net importer of electricity. For each scenario, the island became a net exporter of energy, which would help save the community money each year. For Scenario 1, the grid imports were almost halved compared to the current system, with exports only decreasing slightly. This would be the optimal situation for the island as their energy costs would decrease while still having a significant income from exports. The higher demand in Scenarios 2 and 3 meant that grid imports were increased, with decreased exports, compared to Scenario 1. The island is still a net exporter of energy in these scenarios, so while not as optimal as Scenario 1, both are still more economical long term solution than the islands current system.
|

|
The graph above shows the imports and exports for Scenario 4. Here, as the island is net energy positive, then no imports from the grid are necessary. The exports in this scenario are increased to around 3600 kWh over the course of the year. While this would generate significant income for the island, it also presents a problem in that they would require a new subsea connection cable to be net energy positive. This is due to the high amounts of renewable generation taking the excess electrical production well above the export limit on the current cable.
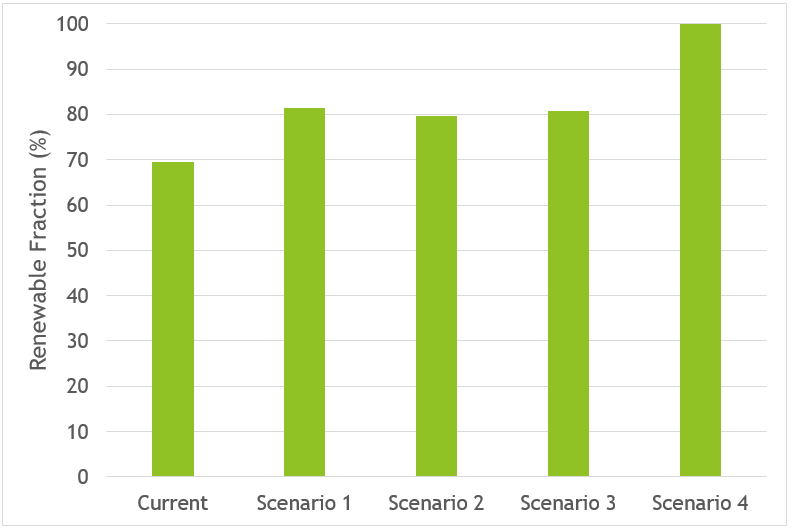
The graph below shows the renewable fraction for the current energy system and each scenario. ‘Renewable Fractoin’ is a performance metric on HOMER that determines the percentage of all electricity consumed and exported on the network that came from a renewable source. It was important to try and increase this value for each scenario, as if the renewable fraction is increased then carbon emissions and grid imports will decrease, due to more energy consumed coming from renewables. As shown in the graph the island currently has a renewable fraction of around 70%, which is relatively high – 70% of all energy consumed in and exported from the island’s community is supplied by their four wind turbines. This was increased up to 80% in Scenarios 1,2 and 3 due to installed PV panels and the batteries allowing more of the energy generated from renewables to be used. For Scenario 4 the renewable fraction was increased to 100% - all energy used and exported on the island is from renewable sources.
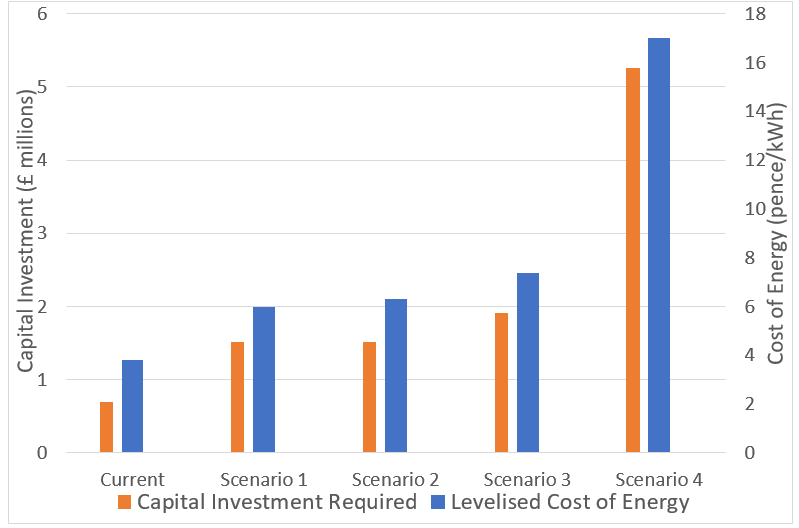
The graph below shows the economic results for each scenario. They were compared in terms of the capital investment required for each new component of the energy system, and the levelized cost of energy which is the resultant cost of energy in pence per kWh, taking all capital requirements into account. The investment required for the current energy system represents the £700,000 re-mortgage on the Enercon wind turbine. Scenarios 1 and 2 would require around 1.5 million pounds investment to pay for the PV and batteries, for Scenario 3 this increases to 1.9 million due to the higher installed capacity of PV and solar. Scenario 2 has a slightly higher cost of energy than Scenario 1 due to the increased need to grid imports. Scenario 4 is by far the most expensive, in terms of both parameters. This was to be expected as if the island is to be net energy positive then large investment will be required to provide enough generation to meet all demands on the island. The 5 million required in the graph above represents the investment needed for the new wind turbine, PV, storage, and infrastructure for anaerobic digestion and biogas. This graph may make Scenario 4 seem unappealing due to the significant costs, however in the long term this could be the most economically beneficial for the island. After the infrastructure investment had been paid off, then the system would be providing enough energy to meet the whole demands of the island, with only operation and maintenance as costs. The implementation of a demand side management strategy as used on the Isle of Eigg would have the potential to significantly reduce the costs required to go net energy positive.