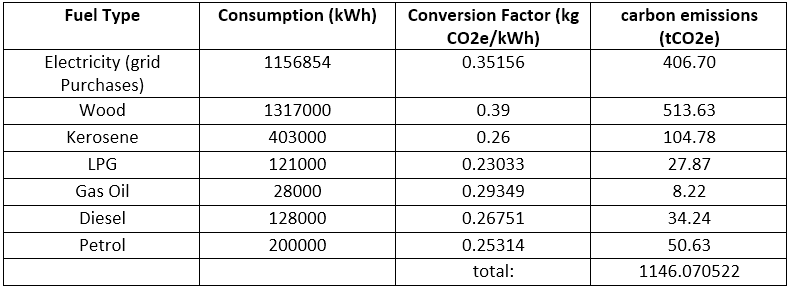
To calculate the carbon footprint from the islands energy system, UK government conversion factors were used [12]. The total annual consumption in kWh for each fuel type, except electricity, was taken from the islands energy audit [1]. This value was then multiplied by the carbon conversion factor to calculate the carbon emissions, in tonnes. The consumption, conversion factor and resultant emissions for each fuel types are shown in the table below. The island’s current total carbon footprint was calculated to be around 1146 tonnes of C02 emissions per annum.
For the electrical consumption figure, the annual grid purchases in the HOMER model of the islands current energy system was used. This was because using the total amount of electricity consumed on the island would invalidate the use of the UK government emission factor for grid electricity, as around 70% of the islands electrical consumption is generated from their wind farms. The conversion factor is only applicable to electricity purchased from the grid, so total annual grid purchases from the HOMER model were used.
For the electrical consumption figure, the annual grid purchases in the HOMER model of the islands current energy system was used. This was because using the total amount of electricity consumed on the island would invalidate the use of the UK government emission factor for grid electricity, as around 70% of the islands electrical consumption is generated from their wind farms. The conversion factor is only applicable to electricity purchased from the grid, so total annual grid purchases from the HOMER model were used.
There was no conversion factor available for kerosene in the UK government guide, so the figure used by German academic, Volker Quaschning was applied [13]. For calculating the emissions from wood, the conversion factor of Volker Quaschning was used instead of the UK governments. This is because the UK government figure assumes the burning of wood to be carbon neutral, with the conversation factor calculating only the emissions from transporting and storing the wood. This factor was therefore not applicable to the island, as the figures for wood consumption in the energy audit is for wood that has been imported to the island. Its emissions are therefore contributing to the island’s footprint, without the neutralising effect of having been grown there. The conversion factor from Quaschning was representative of the amount of carbon released from the burning of wood, so was more accurate for calculating the island’s footprint from imported wood. Quantities were not available for wood that is chopped and burned freely on the island, however this was assumed to be carbon neutral as this wood has grown on the island.
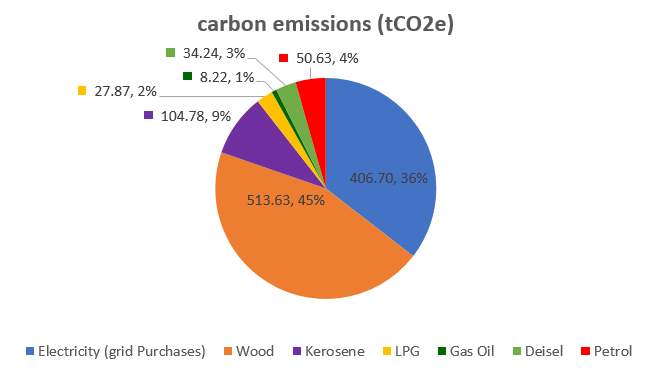
The contribution of each fuel type to the islands total footprint is shown in the pie chart above. As evident in the chart, Wood, kerosense and LPG combined together make up around 56% of the island’s carbon footprint. These three fuel sources are currently used to meet heating demands on the island. This emphasises the de-carbonising potential of the implementation of heat pumps on the island, to drastically reduce the consumption of these three fuel sources, and therefore their carbon emissions. The assumption that electric vehicles will start phasing out traditional cars will reduce the consumption of diesel and petrol and their resultant emissions. To reduce the emissions associated with grid electricity, the installed renewables capacity on the island should be increased.