
|
Scenario 1 |
|
The schematic for the optimal energy system that met our targets for 2030 scenario 1 is shown to the right. 500kW of PV panels and 1.05MW of Lithium-Ion batteries were added to the islands current energy system. The turbines labelled ‘V27’ represent the three 225kW vergnet vestas turbines, and the turbine labelled ‘E33’ is the 330 kW Enercon turbine. The back-up deisel generator is labelled ‘Gen’.
The addition of PV panels contributed to meeting the carbon reduction target by reducing grid dependency in the summer months, when there is lower power output from the wind turbines. Because of the export limit on the grid connection, the addition of extra installed renewables had to be supplemented with storage. Tesla powerpack lithium ion batteries were selected after a performance comparison with Rolls Surrette Lead acid batteries, that are currently used on Eigg - results of which can be viewed here. |

|
|
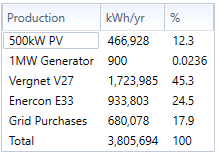
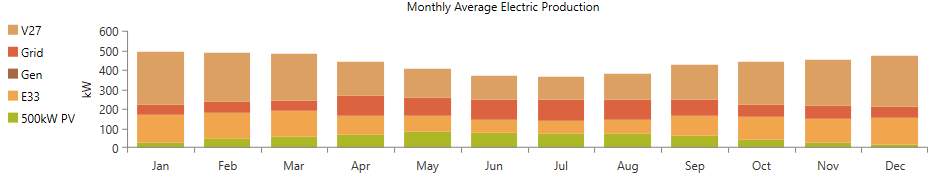
As evident in the graph below of the average monthly production from each energy source, the island is still relying on the grid more heavily in the summer, than in the winter. However, compared to the current system on the island, grid purchases in summer months are reduced in this scenario due to the output from the PV panels. The 4 installed wind turbines still provide for the majority of the island’s electrical production and consumption, with both wind farms together making up around 70%, as shown in the table to the right.
|
|
The total costs for this energy system are shown in the chart below. The values shown here include all required capital investment, replacement parts, and operation and maintenance costs. Due to the £700,000 re-mortgage on the Enercon turbine, this is the largest cost. The cost of the PV installation was priced at £820/kW. This was based on an estimation of £800/kW from the Solar Trade Assocation [15], the extra twenty pounds per kW was factoring in transportation of the panels to the island. The cost per kWh of Tesla power packs was found to be $400/kWh [16], this was converted to £300/kWh. AS can be seen in the graph, grid purchases still amount to a significant cost for the island, despite the reduced imports resulting from the additional installed renewable systems capacity.

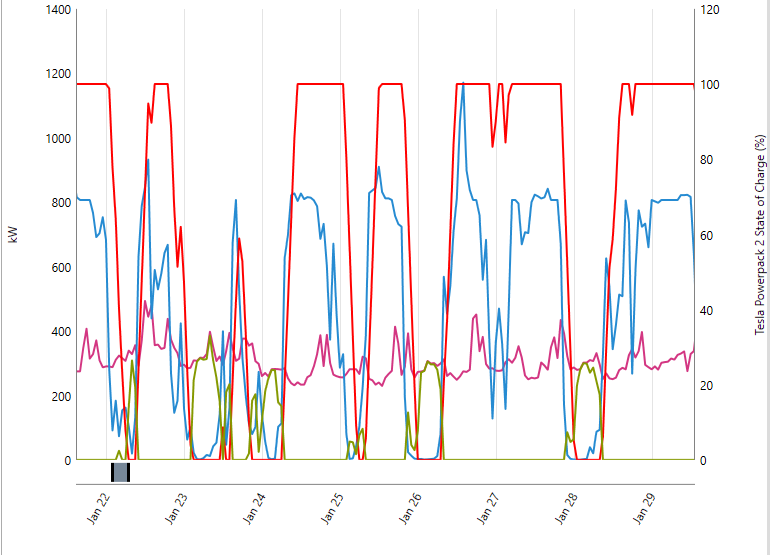
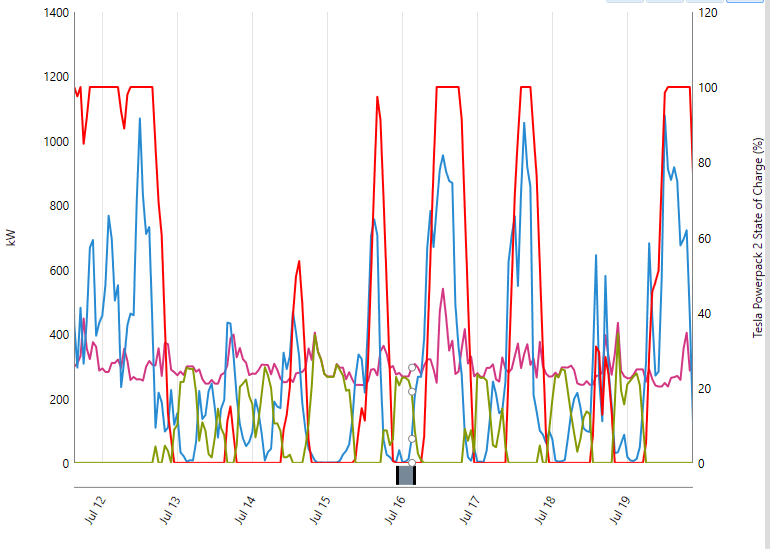
The functioning of the energy system for a Winter (left) and Summer (right) week are shown below. The system here is operating as expected. The batteries charge when there is a surplus of renewables generation, and discharge to meet the load when the renewables output drops. When the load cannot be met from the renewables generation or the batteries, then electricity is imported from the grid.
|
|

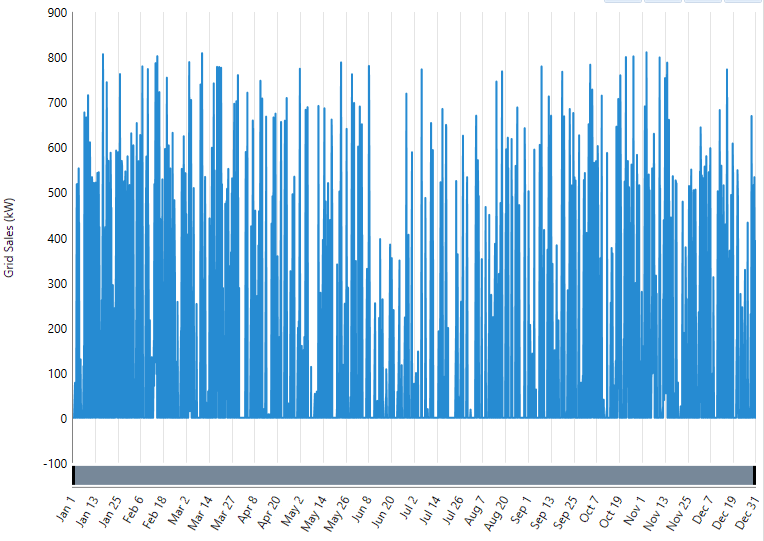
As Gigha have a strict export limit on their subsea gird connection cable, it had to be checked that all exports were less than 1MW. As shown in the graph below, the installed battery bank prevents the additional installed generation from the PV panels taking the exports above the limit. The electrical exports in this system do not go above 800kW throughout the whole year, so this system could be safely implemented without breaking the export cap.
For comparative results between all four scenarios on their carbon footprint, grid imports and exports, and economics, click here.