
The study of electric vehicles is a broad topic with multiple avenues of investigation available, thus, we decided to define the initial scope as only studying the effect of different adoption rates. A degree of project creep occurred where time was available to perform a preliminary investigation into the benefits of controlling the time that residents are permitted to charge their electric vehicle. It was decided to compare an uncontrolled charging model and a basic controlled model.
Uncontrolled Charging
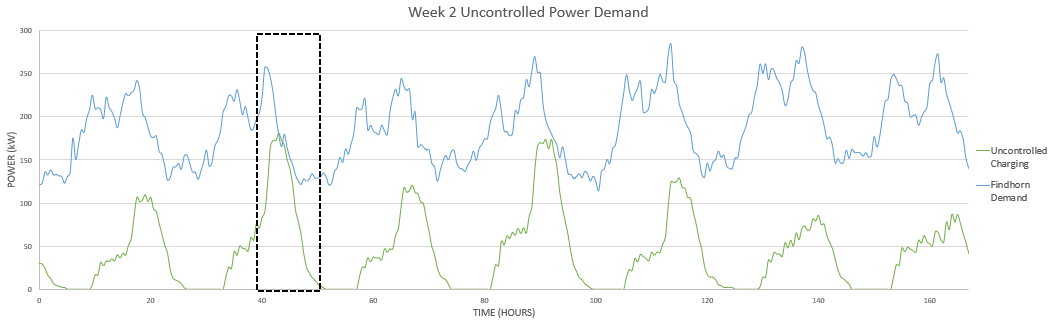
The uncontrolled model has no restraints on the charging of the electric vehicles, with all residents allowed to charge their vehicle at any time throughout the day. This has potential sever implications for the local grid as charging generally occurs when residents return home from work, thus the bulk of the power demand from charging occurs around this time. This aligns with the existing peak demand time period between 5-8 pm which occurs as residents return from work, with a harp increase in turning on appliances, heating etc.
The calculator output for the last week in the simulation (2nd week of useful results) is displayed in the following graph. The highlighted area depicts the Tuesday, chosen randomly as the focus to demonstrate the difference between the charging scenarios. What is noticeable, and problematic, is the green peak representing the EV charging demand occurs at around the same time the peak for the existing demand occurs.
The calculator output for the last week in the simulation (2nd week of useful results) is displayed in the following graph. The highlighted area depicts the Tuesday, chosen randomly as the focus to demonstrate the difference between the charging scenarios. What is noticeable, and problematic, is the green peak representing the EV charging demand occurs at around the same time the peak for the existing demand occurs.
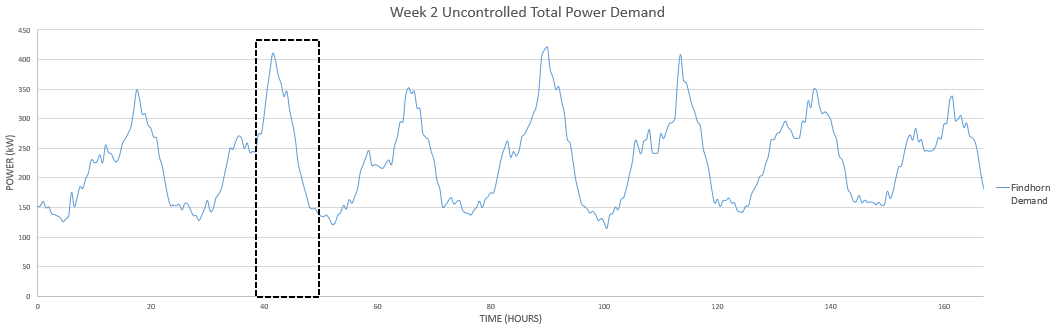
This alignment of the peaks is an issue for the network operator as once the two demands are accumulated, this will amplify the existing peak. This can be seen in the following graph.
The reason this presents an issue for the Findhorn Ecovillage is due to the pricing for grid imports from the national grid, where grid purchases will be subject to a premium price if required during the national peak time. This is explained through examining the generation load structure for a typical day in the UK, shown below
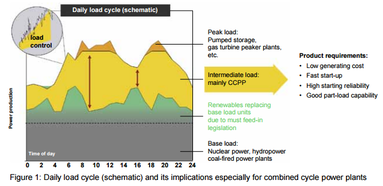
The profile on the left is a typical daily demand profile, where the base and intermediate loads provide sufficient generation for the majority of demand. The peak loads in orange is the times that a local network like Findhorn Ecovillage would desire to avoid requiring grid imports. The reason for this is largely due to the nature of the Capacity Market and the Short Term Operating Reserve (STOR) [1].
STOR was created to provide backup power to meet sudden increases in peak demand through an auction where generators compete to secure contracts to deliver demand to the grid during unexpected peak increases. This is a lucrative option for most as the contract price is higher than the intermediate or base load prices in the Capacity Market. This is why we decided to perform an initial investigation into controlled charging as this would be financially beneficial to Findhorn Ecovillage.
STOR was created to provide backup power to meet sudden increases in peak demand through an auction where generators compete to secure contracts to deliver demand to the grid during unexpected peak increases. This is a lucrative option for most as the contract price is higher than the intermediate or base load prices in the Capacity Market. This is why we decided to perform an initial investigation into controlled charging as this would be financially beneficial to Findhorn Ecovillage.
Controlled Charging
As explained previously, the controlled charging offset the charging time of any resident who returned between 5 and 10pm by 5 hours to restrict any new charging from occurring between these peak times. Now lets look at the new demand profile for the same week.
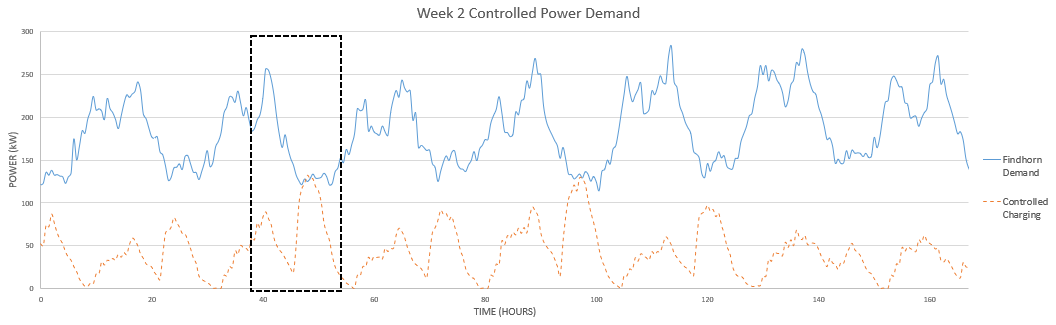
The peak from the EV charging is now offset to the off-peak of the existing Ecovillage demand, and the magnitude is reduced as residual power demand from earlier charging largely finishes before the remaining resident begin charging. The implications for the local grid are shown below.
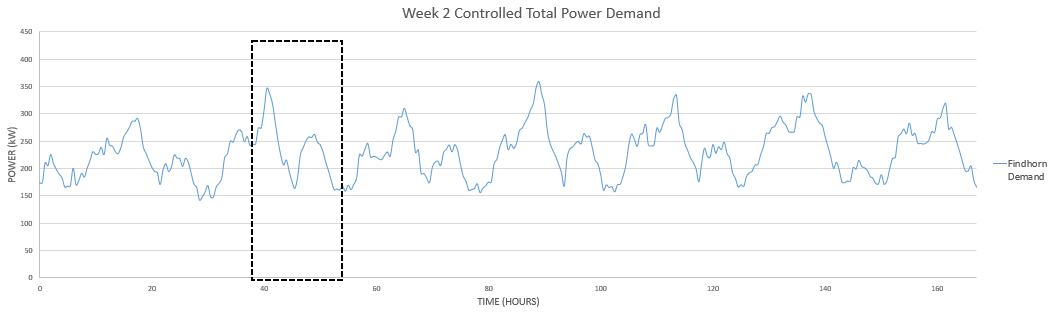
This new profile represents a much more attractive weekly demand for a local network operator, with much less severe peaks which financially lucrative if the local generation cannot match the local demand at all times. This is the case for Findhorn Ecovillage which will be shown in more detail in the section 'Current Demand'.
Comparing the Results
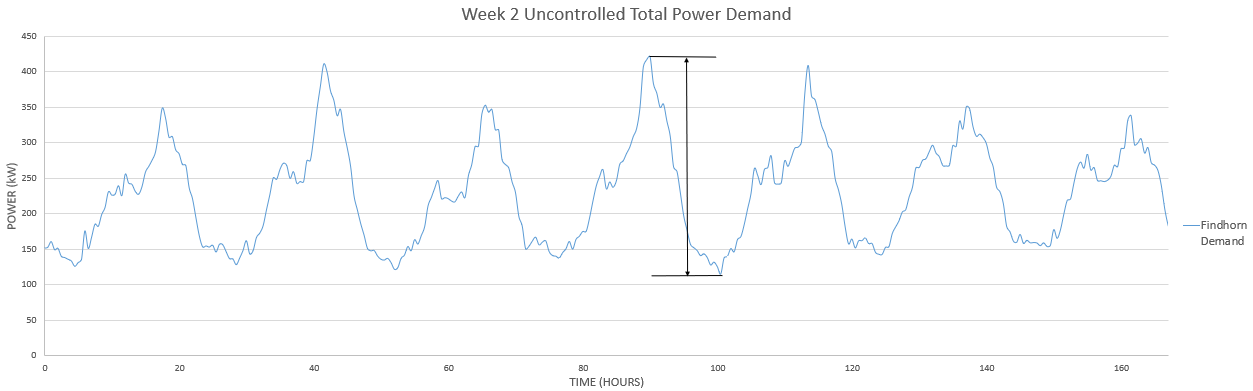
The best comparison for the two sets of results is the difference between the peak and trough of the demand profile, which represents the highest and lowest electrical power demand for the week. This provides an insight into how effective the controlled charging scenario is in levelling the demand profile which is desired if the network operator relies on grid imports to accommodate demand. The following graph depicts the uncontrolled total electrical demand with 100% EV adoption for the week, with the arrow representing the difference in the peak and trough.
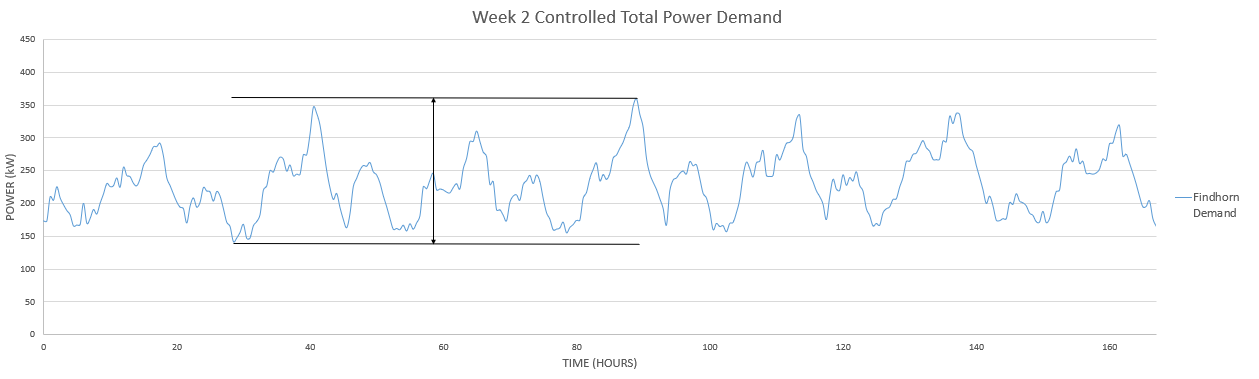
The following graph depicts the controlled total electrical demand with 100% EV adoption for the week, with the arrow again representing the difference in the peak and trough.
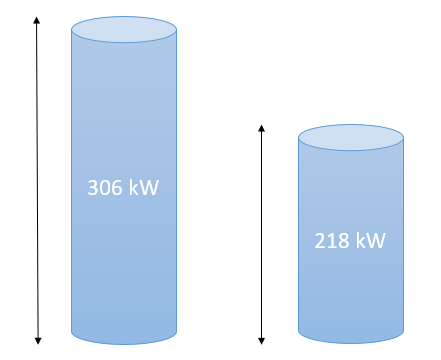
The benefits to the controlled charging scenario can be exemplified by the difference between the peak and trough of the demand profile. For the winter week examined in the above results, the difference for the uncontrolled and controlled is displayed in the corresponding figure respectively.
It is seen that even for the simplified control of restricting new charging between 5-10 pm, the difference decreased from 306 kW to 218 kW. The implications of this is that the controlled scenario offsets the peak into off-peak times of the grid, which allow the network operator to purchase grid imports to account for demand which is not met by local generation. This will be less expensive than purchasing grid imports during peak times on the national grid [2].
It is seen that even for the simplified control of restricting new charging between 5-10 pm, the difference decreased from 306 kW to 218 kW. The implications of this is that the controlled scenario offsets the peak into off-peak times of the grid, which allow the network operator to purchase grid imports to account for demand which is not met by local generation. This will be less expensive than purchasing grid imports during peak times on the national grid [2].
References
[1]. National Grid. (2018). Short term operating reserve (STOR). Retrieved from https://www.nationalgrid.com: https://www.nationalgrid.com/uk/electricity/balancing-services/reserve-services/short-term-operating-reserve-stor
[2]. UK Government. (2018). Feed-in tariffs: get money for generating your own electricity. Retrieved from https://www.gov.uk: https://www.gov.uk/feed-in-tariffs
[2]. UK Government. (2018). Feed-in tariffs: get money for generating your own electricity. Retrieved from https://www.gov.uk: https://www.gov.uk/feed-in-tariffs

UNIVERSITY OF STRATHCLYDE
Address:
16 Richmond St
Glasgow G1 1XQ
United Kingdom
Phone:
+ 44 141 552 4400
Address:
16 Richmond St
Glasgow G1 1XQ
United Kingdom
Phone:
+ 44 141 552 4400