
To model the charging demand for the selected EV adoption scenarios, specific data had to be collected regarding the daily travel for the Ecovillage residents. Unfortunately, sufficient data was not readily available and census data was selected as the best viable option for obtaining the data [reference the website]. The census data allowed us to estimate percentages of the residents that fall within specific criteria of interest, and knowing the total number of residents, we could calculate the number of residents this applied to.
Method of Travel to Work
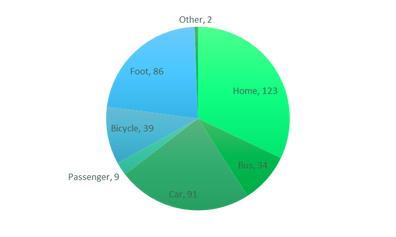 Method of Travel to Work by Ecovillage Residents
To construct a travel profile for the residents, we had to know the number of resident who travel to work by car. This was calculated as 25.8% based on the census data, which correlated to 91 Ecovillage residents.
The 9 passengers shown on the pie chart to the left could be discounted from the profile as we assume they share a ride with another car driver. Both the 39 and 86 residents who travel by bicycle and foot respectively were used in predicting the distances travelled for the car drivers in the proceeding section.
The 9 passengers shown on the pie chart to the left could be discounted from the profile as we assume they share a ride with another car driver. Both the 39 and 86 residents who travel by bicycle and foot respectively were used in predicting the distances travelled for the car drivers in the proceeding section.
Distance Travelled to Work
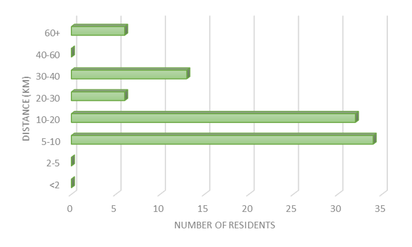 Bar Graph Depicting Distance Travelled for the Residents
To estimate the state of charge of the battery upon arrival for each resident, the distances that each travelled to work had to be known. From the census data we could calculate the number of resident that travelled within a km range, shown in the bar graph to the left.
This data is not ideal in that we were unsure of the specific distances each resident travelled but allowed us to constrain the profile to these values. For each of the 91 residents who travelled by car to work, the corresponding distance was randomly generated. We then ensured that the profile adhered to the criteria provided by the census data.
It is worth noting that from 0-5 km the data set displays no residents travelling this distance to work. This is because the 39 and 86 residents travelling by bicycle and car was subtracting from the data, resulting in a logical assumption that these residents would generally be travelling the smaller distances to work.
Working Hour
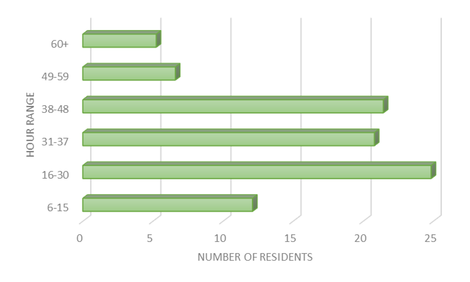 Bar Graph Depicting Hours Worked for the Residents
The charging demand profile would provide a time-series power demand for the electric vehicle owners in the Ecovillage, therefore the time of charge for each resident had to be calculated. Generally, this would be the time that the residents returned home from work midweek. Therefore, we had to know what the weekly hours worked for the residents were, and we could do so in a similar fashion to the distance travelled by obtaining hourly ranges and corresponding number of residents, shown to the left.
A number of logical assumptions were then implemented:
• The daily working hours was estimated based on the weekly hours worked
• The number of days worked per week was estimated based on the weekly hours
As with the distance travelled data, these ranges were used as constraints on the random generation of numbers for the residents. We now had enough data to proceed with constructing a calculator to estimate the charging demand from electric vehicles for the residents who travel to work.
References
1]. DataShine: Census. (2018). DataShine: Census. [online] Available at: http://datashine.org.uk/#table=QS411EW&col=QS411EW0007&ramp=YlOrRd&layers=BTTT&zoom=14&lon=-3.6116&lat=57.6545 [Accessed 12 May 2018].

UNIVERSITY OF STRATHCLYDE
Address:
16 Richmond St
Glasgow G1 1XQ
United Kingdom
Phone:
+ 44 141 552 4400
Address:
16 Richmond St
Glasgow G1 1XQ
United Kingdom
Phone:
+ 44 141 552 4400