
The research of alternatives for mitigation of the increase of imports caused by the increase of demand due to EV adoption, was focused on the already used energy sources. These sources in Findhorn Ecovillage case, are wind and solar PVs. On this section, are displayed the results and comparison of the two sources in terms of which of the two achieved better results for the KPI. For both sources, there was examined the increase for the same capacity, in order to have a common criterion to measure their efficiency for same quantities. Therefore, for both wind and PV capacities there were used the addition of 75 kW, 225kW that were defined by the fixed nominal power output of the wind turbines. Comparisons have been made using the 100% controlled EV demand profile, as these consist the worst case scenario for demand increase and would give more discernible results.
The current situation
The figures below display the time-series wind generation and demand profiles for 100% controlled charging scenario for two representative weeks, a January week for winter and a June week for summer, respectively. The blue profile represents the wind generation, and the red Findhorn Ecovillage demand. The green area for the summer profile represents the currently installed PV capacity. The PV output from PV was not displayed for the winter week, as it is almost zero. The red visible areas represent periods of time where there is an electricity generation deficit to meet demand.
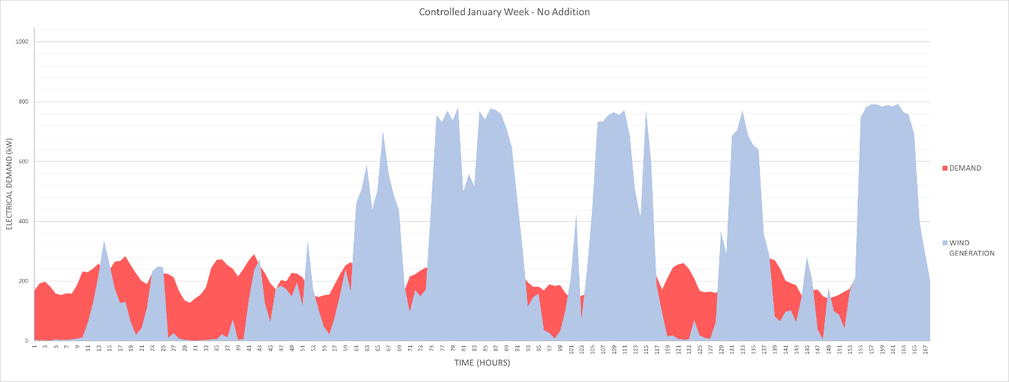
Demand-Wind Generation profile for a representative winter week for 100% controlled charging-No Additional Generation
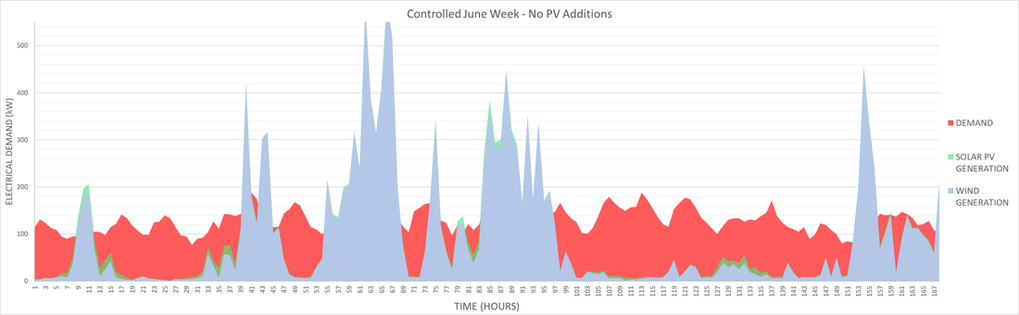
Demand-Wind Generation profile for a representative summer week for 100% controlled charging-No Additional Generation
Without additional generation for these periods, the Ecovillage would have to rely on imports to meet demand. Therefore, the objective of the following analysis was to investigate additional generation capacity to minimise these periods of deficit. Comparing figures above, there is a notable difference in demand not met by generation, resulting in the summer week requiring a greater need for imported electricity. This was apparent throughout the summer months, which was expected as primary electricity generation resource is wind that is abundant at winter but sparse during summer.
Additional Wind Capacity
Given that wind is the primary source of renewable electricity for Findhorn, scaling up wind capacity was the first thing that was examined regarding its impacts on import and surplus rates. The wind power scale up included at first the addition of another V17 (75kW) and then the addition of a V29 (225kW) wind turbine.
V17 (75kW) Addition
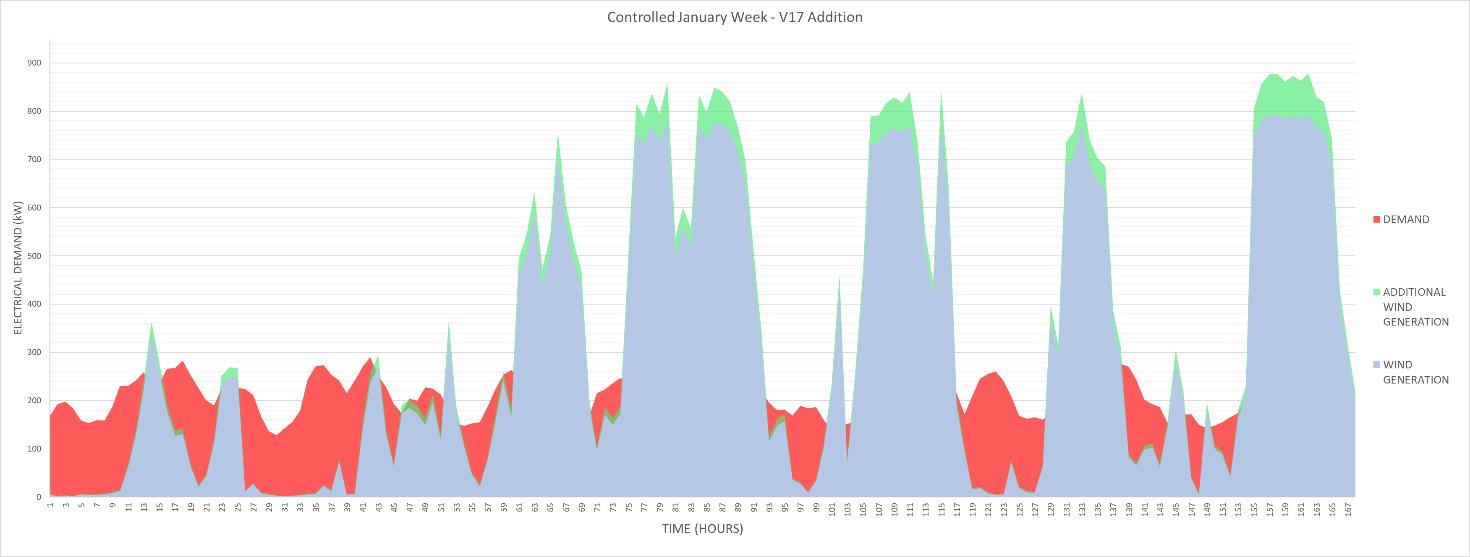
Demand-Wind Generation profile for a representative winter week for 100% controlled charging- 75kW Additional Wind Generation
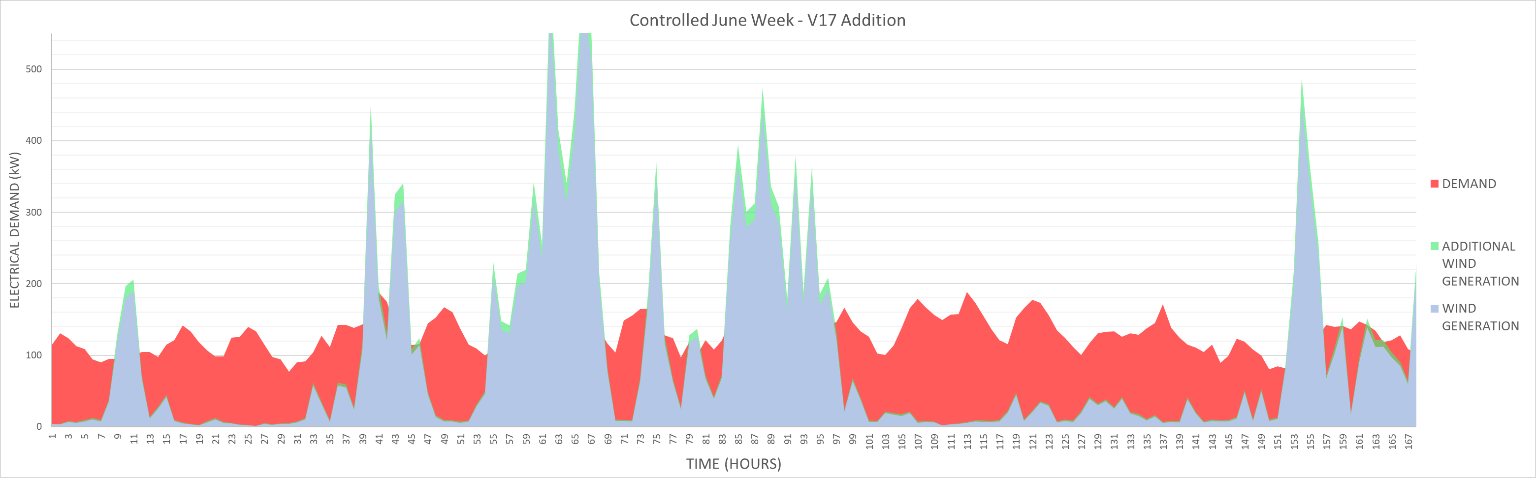
Demand-Wind Generation profile for a representative summer week for 100% controlled charging- 75kW Additional Wind Generation
The impacts of V17 additions can be seen on the figures above for the winter and summer week respectively. On both cases, the extra energy generated, which is on green, is mostly out of the red area, by which the deficit is represented. This practically means that the imports are not reduced, but only surplus is increased. Also, the addition of this extra wind capacity, using the smaller capacity wind turbines does not seem to improve the situation during summer months.
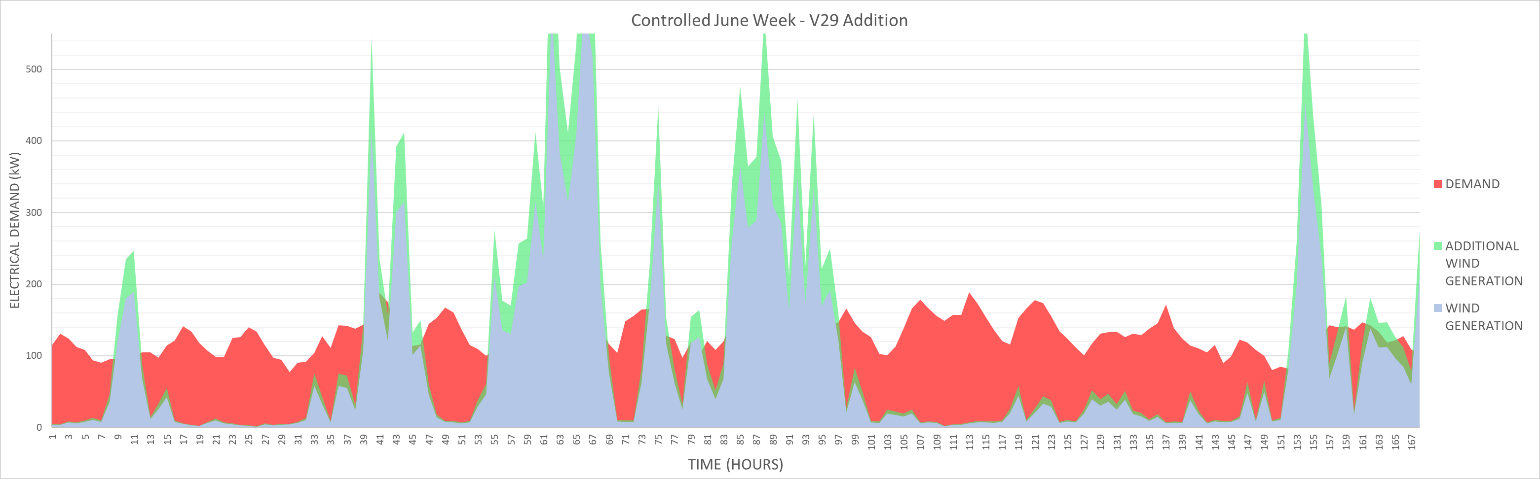
V29 (225kW) Addition
Afterwards, there were examined the impacts that the addition of one of the bigger capacity V29 (225 kW) wind turbines would have for the winter and summer week. As represented by the graphs below, the impacts were qualitatively the same but with larger amplitude, with additional wind capacity increasing the surplus further during winter and summer week and not improving significantly the imported quantities of imported energy.
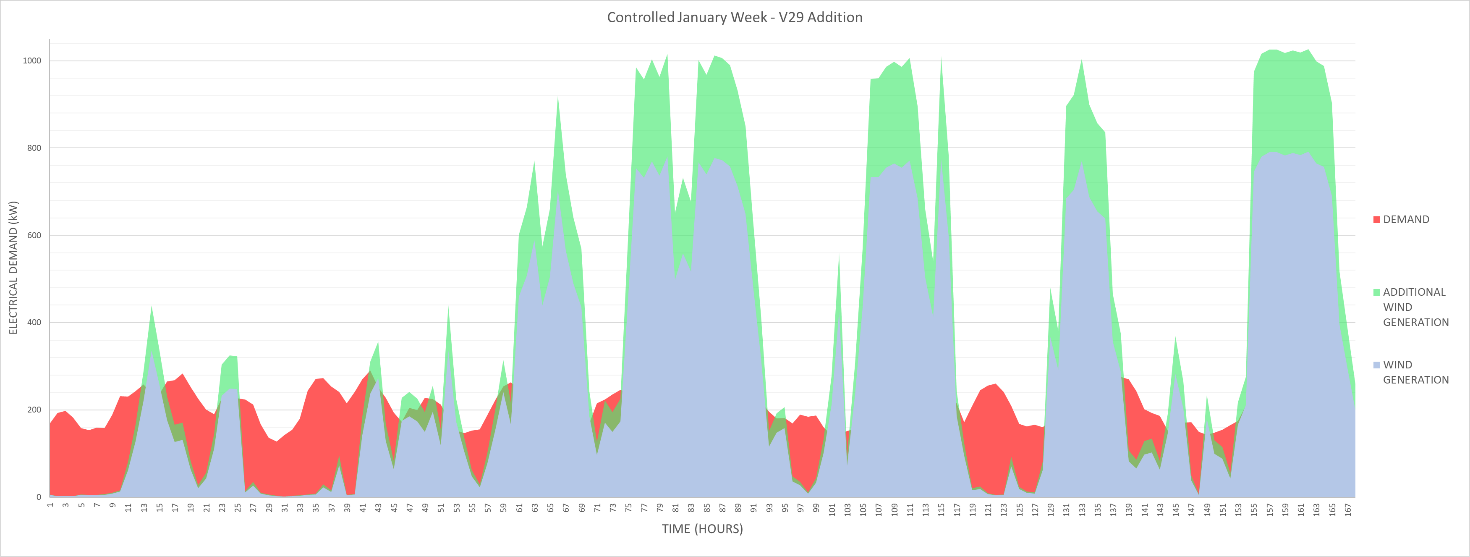
Demand-Wind Generation profile for a representative winter week for 100% controlled charging- 225kW Additional Wind Generation

Demand-Wind Generation profile for a representative summer week for 100% controlled charging- 225kW Additional Wind Generation
Initially, the addition of the V17 wind turbines was attempted in order to investigate if the problem in wind generation at periods of the summer is the low speed of the wind. Currently, 3 out of 4 wind turbines are of 225 kW nominal capacity. The problem for these wind turbines might have been cut-in speeds higher than the speeds of wind. The increase of smaller wind capacity wind turbines, with lower cut-in speeds though did not solve the problem, as the actual issue proved to be the lack of wind rather than the low wind speeds.
These findings led to the search of a solution that would improve the intermittency of wind as an energy source during the summer months and consequently improve our KPI. So, this led to the investigation of the other alternative, which was the increase of the solar PV capacity.
Solar PV Addition
The figures below display the impact that the adoption of 75kW and 225kW of solar PV respectively have on the imports, for the same representative June week examined on previous cases. The increase of PV capacity does not reduce the imports on winter period significantly. The low energy output from PVs at this period is not due to small installed capacity, but because of reduced sunlight radiation and limited daytime period. Therefore, the winter week profiles including PV capacity increase were not included in this comparison, due to their low impact.
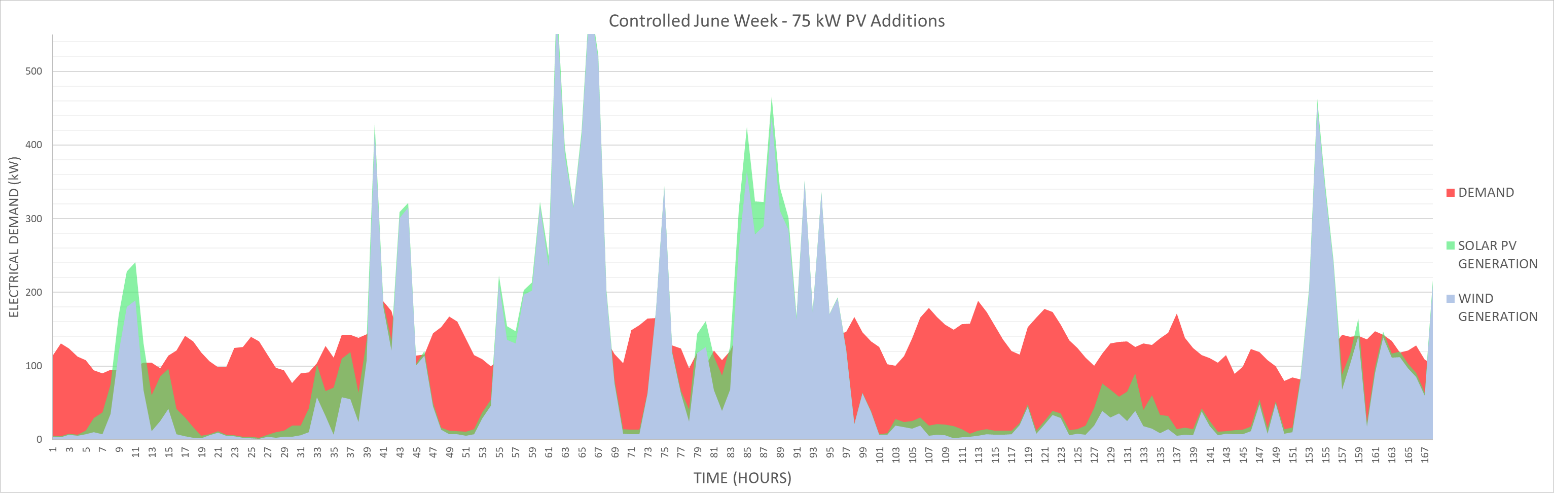
Demand-Wind Generation profile for a representative summer week for 100% controlled charging- 75kW Additional Solar PV Generation
Demand-Wind Generation profile for a representative summer week for 100% controlled charging- 225kW Additional Solar PV Generation
Although additional PV capacity has negligible impact during winter period situation improves significantly during summer. Apart from the surplus that is created, there is also a notable increase in renewable energy generation on periods that appeared to have deficit, thus less energy is now imported from the grid. This can be observed from the significant increase in common green and red areas, especially on the graph for 225 kW addition.
Comparison of Results
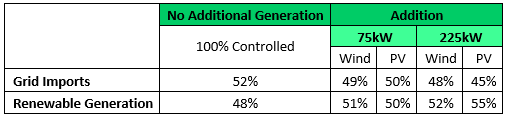
On this section, there is presented a comparative evaluation of the annual results for the different additions regarding imports, surplus and demand met by generation. From the of the Table below, it is obvious that for the 75 kW capacity the addition of wind generation reduces the energy imports only 1% more than the PV addition does. As we scale up to 225 kW though, PV addition seems to have better results in terms of Grid Imports. The Renewable Generation-covered fraction of Demand follows an increase as the Grid Imports reduce.
Grid Imports-Renewable Generation rates comparison
The Table below, contains a more detailed analysis of the comparison of the two different sources in terms of utilisation of the total renewable output and the Imports and gives a clearer view. The PV addition generally achieves lower percentages for grid imports, higher demand met by generation and lower surplus rates. From these results, it seems that addition of wind capacity certainly would not improve more the Imports than the addition of PV would. So, PV achieves better results for our KPI. Regarding the demand met by generation, which is an index related to the total load and imports, PV also achieves better results. These better results are due to the fact that the output of PVs is used at periods that generation from wind is low or even zero.
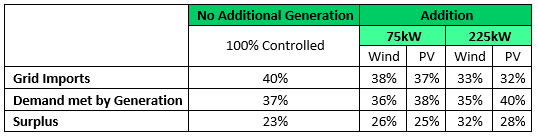
Grid Imports-Demand met by Generation-Surplus rates comparison
Higher rate of demand met by generation for PVs results to lower surplus, as the surplus is affected by the total renewable output and demand met by generation. Comparatively, the output of PVs is lower and the demand met by generation is higher than the wind. This results to smaller difference for PVs. Apart from that, adding more wind capacity as seen from the figures, increases the output only on the already existing peak area of generation
Increasing solar capacity seemed to achieve greater reduction of imports than the increase of wind capacity. The increase of solar capacity along with the results for 'battery storage' shown that these two resources affect more the examined KPI. Therefore, their combinations needed further investigation, in order to find the most suitable solution.

UNIVERSITY OF STRATHCLYDE
Address:
16 Richmond St
Glasgow G1 1XQ
United Kingdom
Phone:
+ 44 141 552 4400
Address:
16 Richmond St
Glasgow G1 1XQ
United Kingdom
Phone:
+ 44 141 552 4400