
Charger Demand Simulator
The Simulink circuit shown on the picture below, was used to calculate the power demand for the chosen EV models. It was built entirely from start and its main purposes are the SOC, Power Consumption estimation over time. The circuit outputs are then used by The Calculator to build the EV Charging Demand Profiles, based on the Ecovillage Demand Residents Travel Profile. The model consists of four subsystems, numbered and described below.
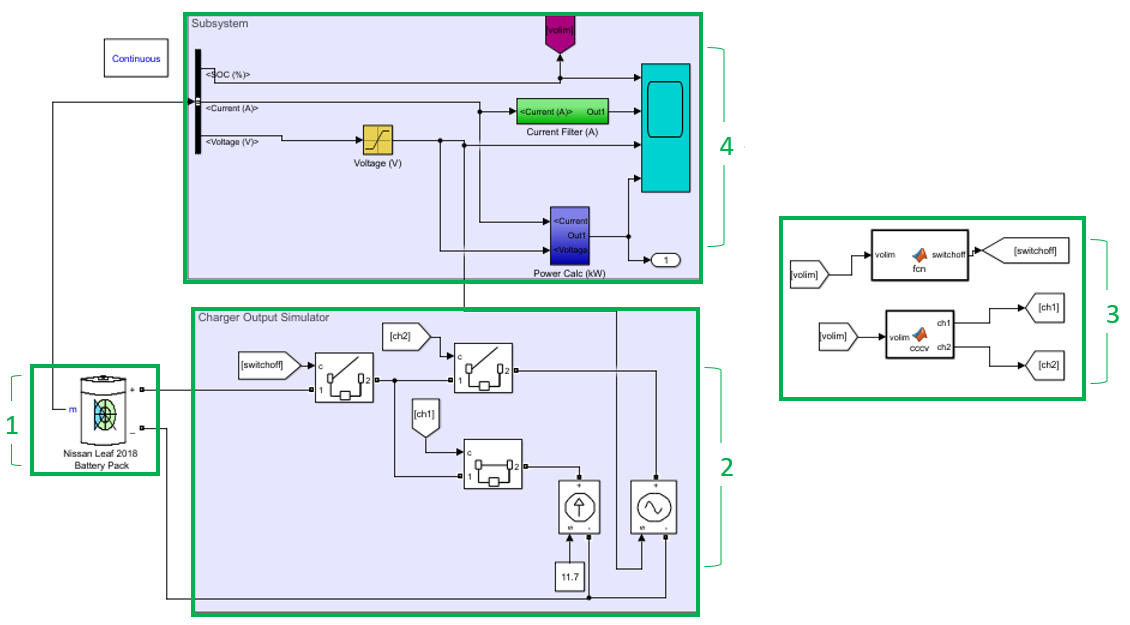
1 - Battery Model; 2 - Power Circuit; 3 -Control Algorithm; 4 - Signal Output Circuit
Simulink Circuit Components Breakdown
1. Battery Model |
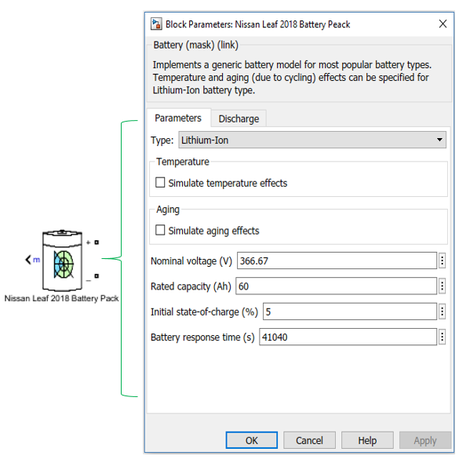
In Figure, is shown the tab with the input parameters of the generic model that Simulink has for batteries. The most basic parameters in the modelled cases are:
The parameters for the three chosen EV models, are shown below:
- Battery Type.
- Nominal Voltage.
- Rated Capacity.
- Initial State of Charge.
The parameters for the three chosen EV models, are shown below:
|
Renault Zoe [1]:
Type: Li-Ion Nominal Voltage (V): 360 Rated Capacity (Ah): 72 Initial SOC: Variable |
2. Power Circuit
This circuit consists of 3 circuit breakers, a controlled current source, a constant block and a controlled voltage source.
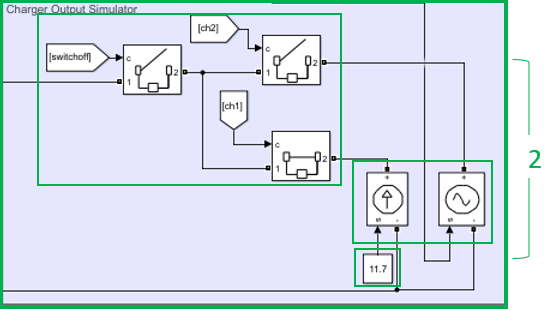
Power Circuit subsystem and its components
|
Operation:
|
3. Control Algorithms
|
Two control algorithms are applied in this case. They use signal “volim” as input and their outputs are “switchoff” and “ch1”, “ch2” control signals. The first algorithm is used to cut off any power supply after the SOC is 100%. The second algorithm keeps the circuit breaker of current source closed and the circuit breaker of the voltage source open until battery reaches 80% of its SOC. After that, it closes the circuit breaker of voltage source and opens the current source circuit breaker, switching from constant applied current to constant voltage.
|
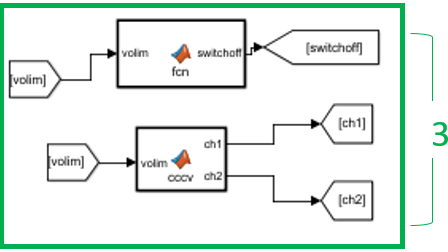
Control Algorithms used for CCCV charging
|
4. Signal Output Circuit
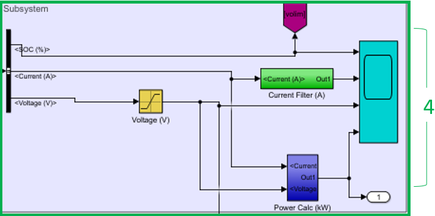 Signal Output circuit
This circuit consists of the bus selector, the filters and the scope. This circuit processes and scopes the selected signals of the battery over time (s). In our case these signals are: SOC, Power in kW, Battery Voltage in V, Charging Current in A. Filters are used to limit the ripple that some signals have and give a more linear output with less fluctuations. The scope output for the three simulated EV models full charging (0-100% SOC), can be seen on the figures below.
Simulink Model Outputs
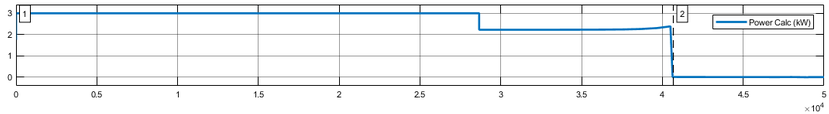
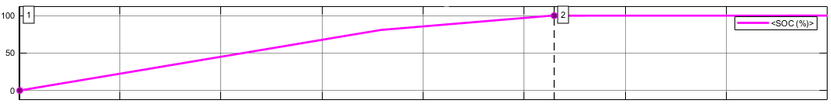
The outputs to the Simulink model of interest were the SOC variance over time, and the corresponding power demand variance over time. The results for the BMW i3 are displayed below.
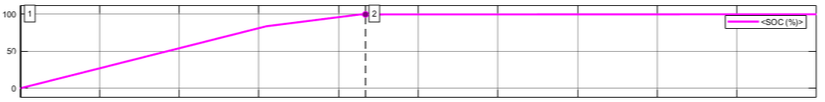
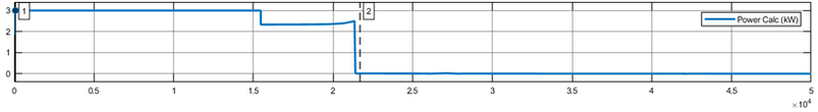
As shown above, the power demand remains constant at the 3kW maximum before instantaneously reducing to around 2.2kW for the remaining charge, until dropping off to 0kW once the charge is complete, represented by the vertical dotted line. The x-axis on the bottom depicts time in 10000 seconds. Now lets compare how the larger capacity battery for the Nissan Leaf compares.
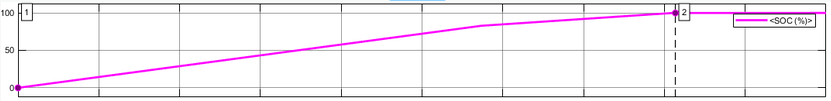
As expected, the maximum power demand is the same due to the same 3kW home charging utilised, however, the total time for charge has significantly increased. This is due to the larger battery capacity. The results for the Renault Zoe is shown below.
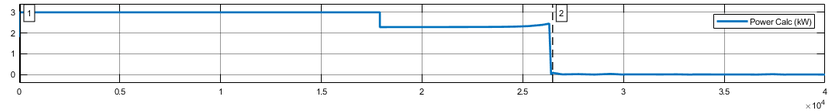
Given that the output of the charging method is specific (3kW), what changes for each vehicle is the charging time. As seen from figures above, it takes almost 7 hours for BMW i3, 12 hours for Nissan Leaf and 8 hours for Renault Zoe to charge fully.
These demand profiles are used by the calculator, to extract the demand profiles for the different adoption rates. These new demand profiles were later examined, to investigate impacts on our KPI and possible solutions to incurring problems.
These demand profiles are used by the calculator, to extract the demand profiles for the different adoption rates. These new demand profiles were later examined, to investigate impacts on our KPI and possible solutions to incurring problems.
References
[1]. cleantechnica.com. (2016, November 11). https://cleantechnica.com. Retrieved from Details On Renault Zoe ZE 40 Battery Packs: https://cleantechnica.com/2016/10/11/details-renault-zoe-ze-40-battery-packs/
[2]. Feng, L., Ming Tan, C., & Pecht, M. (2015). Effect of Temperature on the Aging rate of Li Ion Battery Operating above Room Temperature. New York: PMC-NCBI.
[3]. insideevs.com. (2017, December 25). BMW i3 With 120Ah Battery Coming In Late 2018. Retrieved from https://insideevs.com: https://insideevs.com/bmw-i3-with-120ah-battery-coming-in-late-2018/
[4]. Muneer, T., Lal Kolhe, M., & Doyle, A. (2017). Electric Vehicles: Prospects and Challenges. Amsterdam: Elsevier Publications.
[5]. PushEVs. (2018, January 29). 2018 Nissan Leaf battery real specs. Retrieved from https://pushevs.com: https://pushevs.com/2018/01/29/2018-nissan-leaf-battery-real-specs/
[6]. Warnecke, A. (2015). Ageing effects of Lithium-ion. EPE Conferences (pp. 4-19). Geneva: Workshop EPE Conferences.

UNIVERSITY OF STRATHCLYDE
Address:
16 Richmond St
Glasgow G1 1XQ
United Kingdom
Phone:
+ 44 141 552 4400
Address:
16 Richmond St
Glasgow G1 1XQ
United Kingdom
Phone:
+ 44 141 552 4400