
Referring to the original Project Aim, "To study the adoption of electric vehicles would have on the electrical supply/demand for Findhorn Ecovillage", a model that predicts the annual power demand that arises from the adoption of electric vehicles due to the electrical charge required instead of fuel had to be constructed. Now that the Simulink model had been built and simulated, and with the Ecovillage residents travel data acquired, a calculator could now be built. The overall process of the calculator is simplified in the following schematic to provide an understanding of the process involved in the modelling.
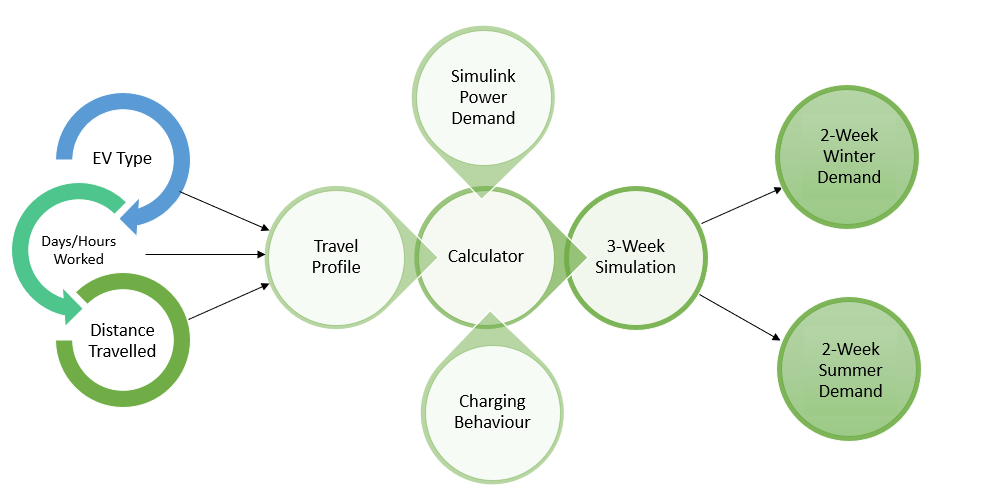
The inputs used to generate the travel profile were acquired as detailed in the previous section ‘Ecovillage Residents Travel Profile’.
|
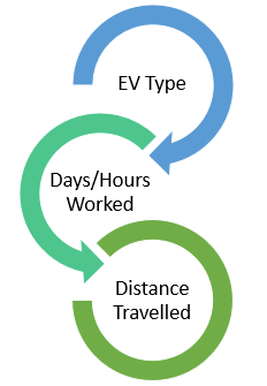
The electric vehicle type had to be specified as this alters the charging requirements, e.g. the Leaf had a larger battery capacity and therefore requires charging less often than the i3 and Zoey.
The weekly hours worked was calculated as shown previously, which was translated into daily hours through an assumption based upon the quantity of hours. The number of days was estimated based upon weekly hours, and each resident was randomly assigned Monday-Friday working days if working less than 5 days. The distance travelled data was assigned through generating random number within each km data range shown in ‘‘Ecovillage Residents Travel Profile’.’. This data was used as a constraint to ensure all randomly generated numbers fell within the ranges provided. |
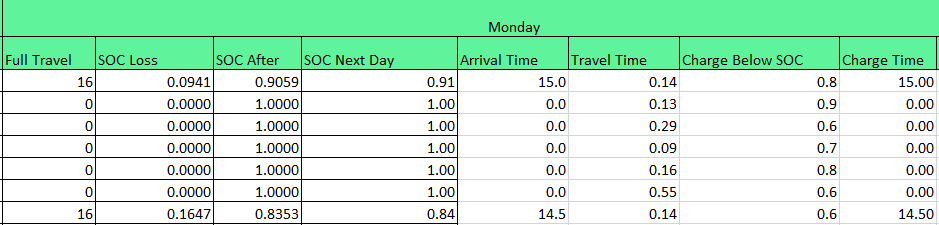
This methodology was applied, and an example of the inputs to the calculator within the excel sheet are shown below:
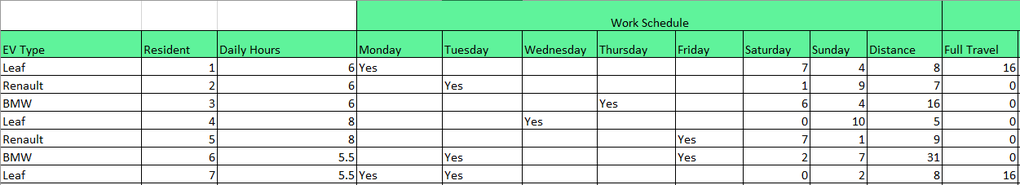
If the value of the cell for a specific day was ‘Yes’, the calculator would then assume that the resident travelled the assigned distance to work and back. The daily hours were then used, along with the travel time assuming an average speed of 30 mph, to calculate the time of arrival for each of the Ecovillage residents. The charging time was then calculated depending on Uncontrolled or Controlled charging.
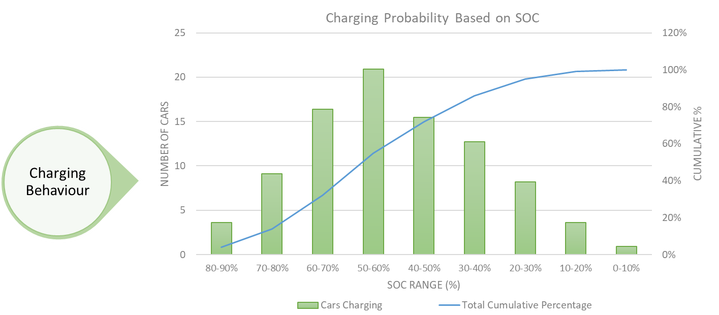
Now that the profile had been generated, the charging behaviour was integrated into the Travel Profile. This utilised results from a study performed by My Electric Avenue which studied 2000 Nissan Leaf drivers over 3 years to determine a probability of charging based upon the State of Charge upon arrival [1]. The probability distribution function was applied to the 91 residents of interest and the results are summarised below:
Now that the profile had been generated, the charging behaviour was integrated into the Travel Profile. This utilised results from a study performed by My Electric Avenue which studied 2000 Nissan Leaf drivers over 3 years to determine a probability of charging based upon the State of Charge upon arrival [1]. The probability distribution function was applied to the 91 residents of interest and the results are summarised below:
A fundamental requirement for the calculator was to determine the state of charge of the battery after each trip for every resident, each day. To achieve this, the discharge rate for each EV type per km was investigated and applied to the model. We obtained the average discharge rate for each battery, with the average used due to the complexities involved with integrating driver behaviour to the calculator [2].
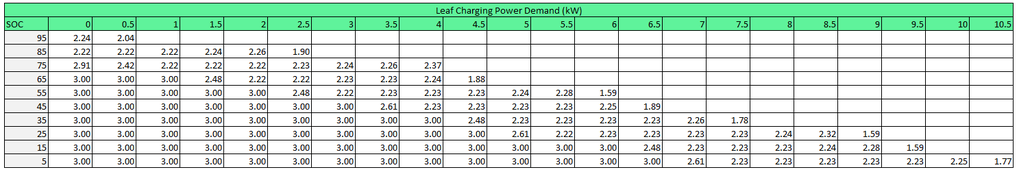
The Simulink results from the previous section had to be formatted to allow the calculator to estimate a charging power demand based on the state of charge upon arrival and if said resident was charging that day. To do so, we ran the Simulink model for each EV type at incremental SOCs to get a power demand, and rounded the SOC to the nearest 10%. The Nissan Leaf results in the above format can be seen below.

The total power demand for the 91 residents for each day could now be calculated. The model simply calculates the individual power demand in a 30-minute time step using the methodology described above, and calculates the time of charge based upon the arrival time of the resident. The controlled charging time was implemented by offsetting the time of charge for residents arriving between 5-10 pm by 5 hours to restrict any new charging occurring in the peak hours. The final calculation is to sum the total power demand for time interval across the day, i.e. 0:00, 0:30 etc. The calculator now had a predicted electric vehicle charging demand for the 91 residents for a 3-week time period, with the initial week run to randomise the starting results and the latter 2 weeks used as the results. This was vital to the merit of the calculator as taking the first 2 weeks would see every vehicle begin with an initial SOC of 100%, implying that every residents purchases their EV at the same time; an unrealistic assumption.
The final process involved was simulating a winter and summer 2-week period, performed due to the difference in EV battery discharge rate based upon the external temperature. In the winter, the discharge rate is generally higher due to the heating requirement inside the car. This was accounted for by researching the different discharge rates for winter and summer, and running the model using these for both a winter 2-week period and a summer 2-week period. The winter results was extrapolated across 6 months, with the summer the other 6 months to give an annual power demand profile.
The above calculator looked at the 91 residents who travelled to work by car, however, the census showed that 123 residents worked from home and they could not be discounted from owning a vehicle. Therefore, a second model using a similar methodology detailed was constructed to account for these residents, shown in the next page.
The 100% EV calculator is available, with controlled and uncontrolled charging, for download in the 'Downloads' section.
References
[1] Myelectricavenue.info. (2015). About the Project | My Electric Avenue. [online] Available at: http://myelectricavenue.info/about-project [Accessed 12 May 2018].
[2] EV Database. (2018). EV Database. [online] Available at: https://ev-database.uk/ [Accessed 12 May 2018].
[2] EV Database. (2018). EV Database. [online] Available at: https://ev-database.uk/ [Accessed 12 May 2018].

UNIVERSITY OF STRATHCLYDE
Address:
16 Richmond St
Glasgow G1 1XQ
United Kingdom
Phone:
+ 44 141 552 4400
Address:
16 Richmond St
Glasgow G1 1XQ
United Kingdom
Phone:
+ 44 141 552 4400