
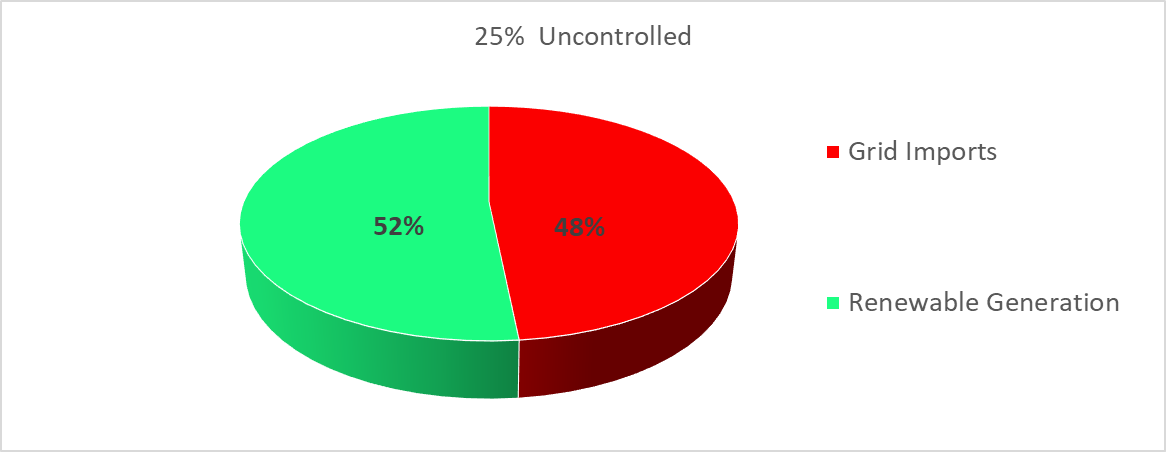
25% EV Adoption rate
The pie charts below show the energy mix of Imports-Renewable Generation that covers the electrical Load of Findhorn Ecovillage for 25% of EV adoption. Comparing the pie charts for both controlled and uncontrolled charging with the current situation graphs, it is obvious that grid imports increase from 46% to 48%. Consequently renewable generation usage rate, decreases from 54% to 52%. The increase of imports is caused by the increase of electrical load that the charging of EVs adds to the grid of the Ecovillage. As load increases and generation remain as it is (no additional generation), the increase in demand is covered by imported energy from the grid. The need for imports is even greater, when this additional load occurs at periods of low power output from renewables and it has to be served almost entirely from the grid.

|
|
The renewable generation fraction, as explained earlier depends on total load and imports. The simultaneous increase of imports percentage (due to load not covered by generation) and generation being unchanged, causes the decrease in renewable generation energy usage rate.
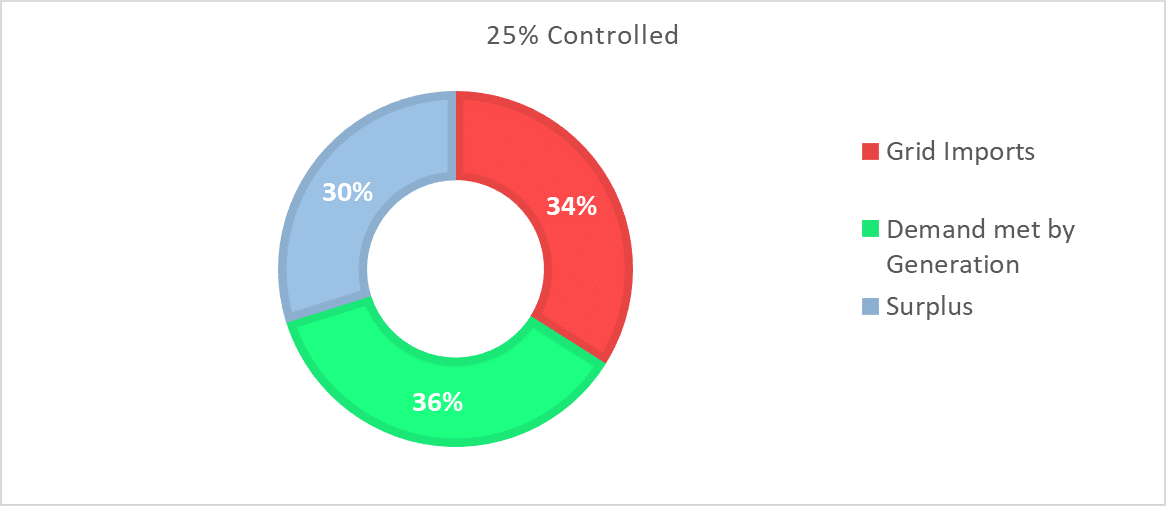
After analysing results for 25% EV adoption and comparing to the current situation, the Surplus reduces from 33% to 30%. This happens because part of the Surplus is used to cover the additional load that occurs due to the increase of the incurring demand of the EV charging. Demand met by generation for this adoption rate remains almost the same (difference below 0.5%).
|

|
25% EV adoption rate corresponds to a small number of vehicles, whose charging does not have very significant impact on grid imports, as displayed on the results graphs. This adoption rate would still allow Findhorn to be a net exporter of energy, as imports remain below 50%, but would also reduce the financial profit due increase of energy utilised from Surplus for charging, thus the reduction of the amount of sold energy to the grid.
A notable observation on the pie and doughnut charts, is that for controlled and uncontrolled charging, results for grid imports and renewable generation are the same (difference in results is below 0.5%, so not displayed). This happens because on both scenarios the power demand is the same. What changes, is the distribution of this demand over time and especially the distribution of peaks of demand. As explained on the 'Uncontrolled&Controlled Simulator Results' sections, the peak for uncontrolled charging happens the same time period as the peak of the existing demand of the Ecovillage. For the controlled charging, this peak shifts to time periods of low demand. The amount of energy consumed on both cases is almost the same but the time duration and period of appearance for the load is different. For that reason, the rates that are depicted on pie charts are the same.
Due to this similarity, from this point on the displayed graphs and charts are going to be the ones that contain data of controlled charging.
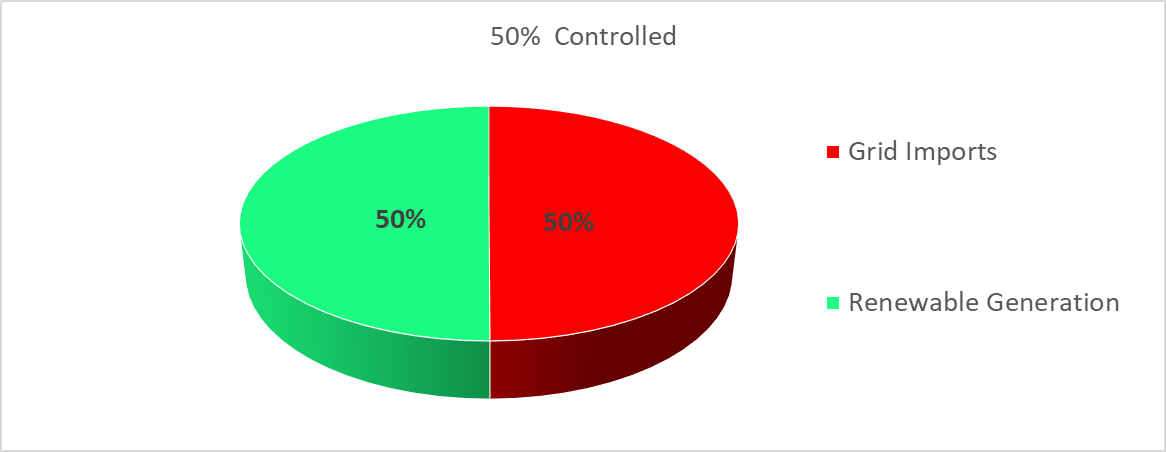
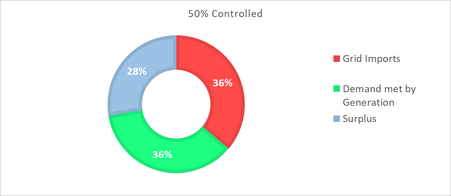
50% EV Adoption rate
As depicted on the pie chart below, for the 50% EV adoption rate, grid imports cover the 50% of the total energy demand, leaving the other 50% to generation from renewables. This is a critical situation and shows that after electrifying half of the entire number of vehicles Findhorn Ecovillage is no longer a net exporter of electricity, but transcends to an import-export balance. Only a small further increase in demand beyond that point, could distort this balance and convert the Ecovillage to net importer of electricity. After that point, the examined KPI’s values become unacceptable so for adoption rates above 50% mitigation measures suggestions are required. These mitigation measures on this case include the potential use of additional generation, energy storage or even both.
|
|
75% EV Adoption rate
For the 75% EV adoption rate, Findhorn Ecovillage would be clearly a net importer of electricity as 51% of its load would be served by energy imports from the grid and 49% would be covered by the local renewable generation. At this rate the surplus is further decreased to 25% of the total renewable energy output.
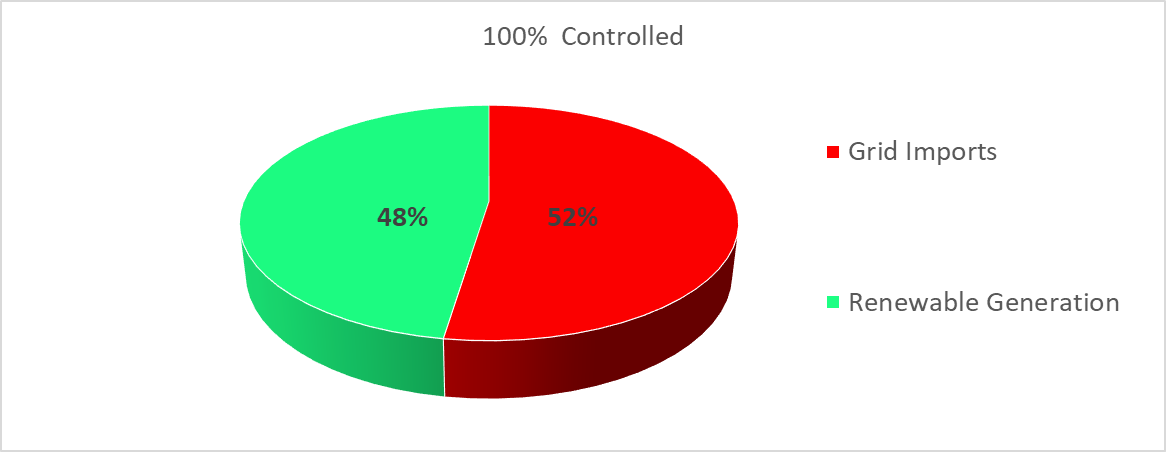
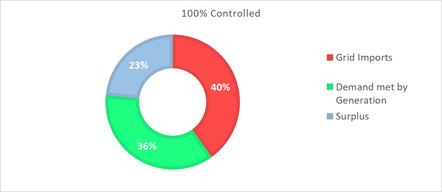
100% EV Adoption rate
The most extreme of the examined EV adoption scenarios is the one for 100% EV adoption, which implies that all of the conventional vehicles currently used in Findhorn Ecovillage would be replaced by electric ones. If this scenario is ever realised, this would happen gradually in a few-year horizon, as it is high unlikely that all the residents will turn to EVs simultaneously. This case is studied though, as it opposes the worst case scenario for demand increase due to electric vehicles, and it allows to make an estimation on the magnitude of the investigated mitigation measures required, in order for the KPI of the project to remain between acceptable limits.
|
|
As seen from the charts above, the complete replacement of conventional with electric vehicles would bring massive implications on the energy demand, imports and surplus. Renewable generation serves only 48% of the load, while the 52% is covered by grid imports. The increase of demand reduced also the surplus to 23%, as more energy from the renewables is used. This reduces the residue available for sale to the grid and as a result minimises the possible profit.

UNIVERSITY OF STRATHCLYDE
Address:
16 Richmond St
Glasgow G1 1XQ
United Kingdom
Phone:
+ 44 141 552 4400
Address:
16 Richmond St
Glasgow G1 1XQ
United Kingdom
Phone:
+ 44 141 552 4400