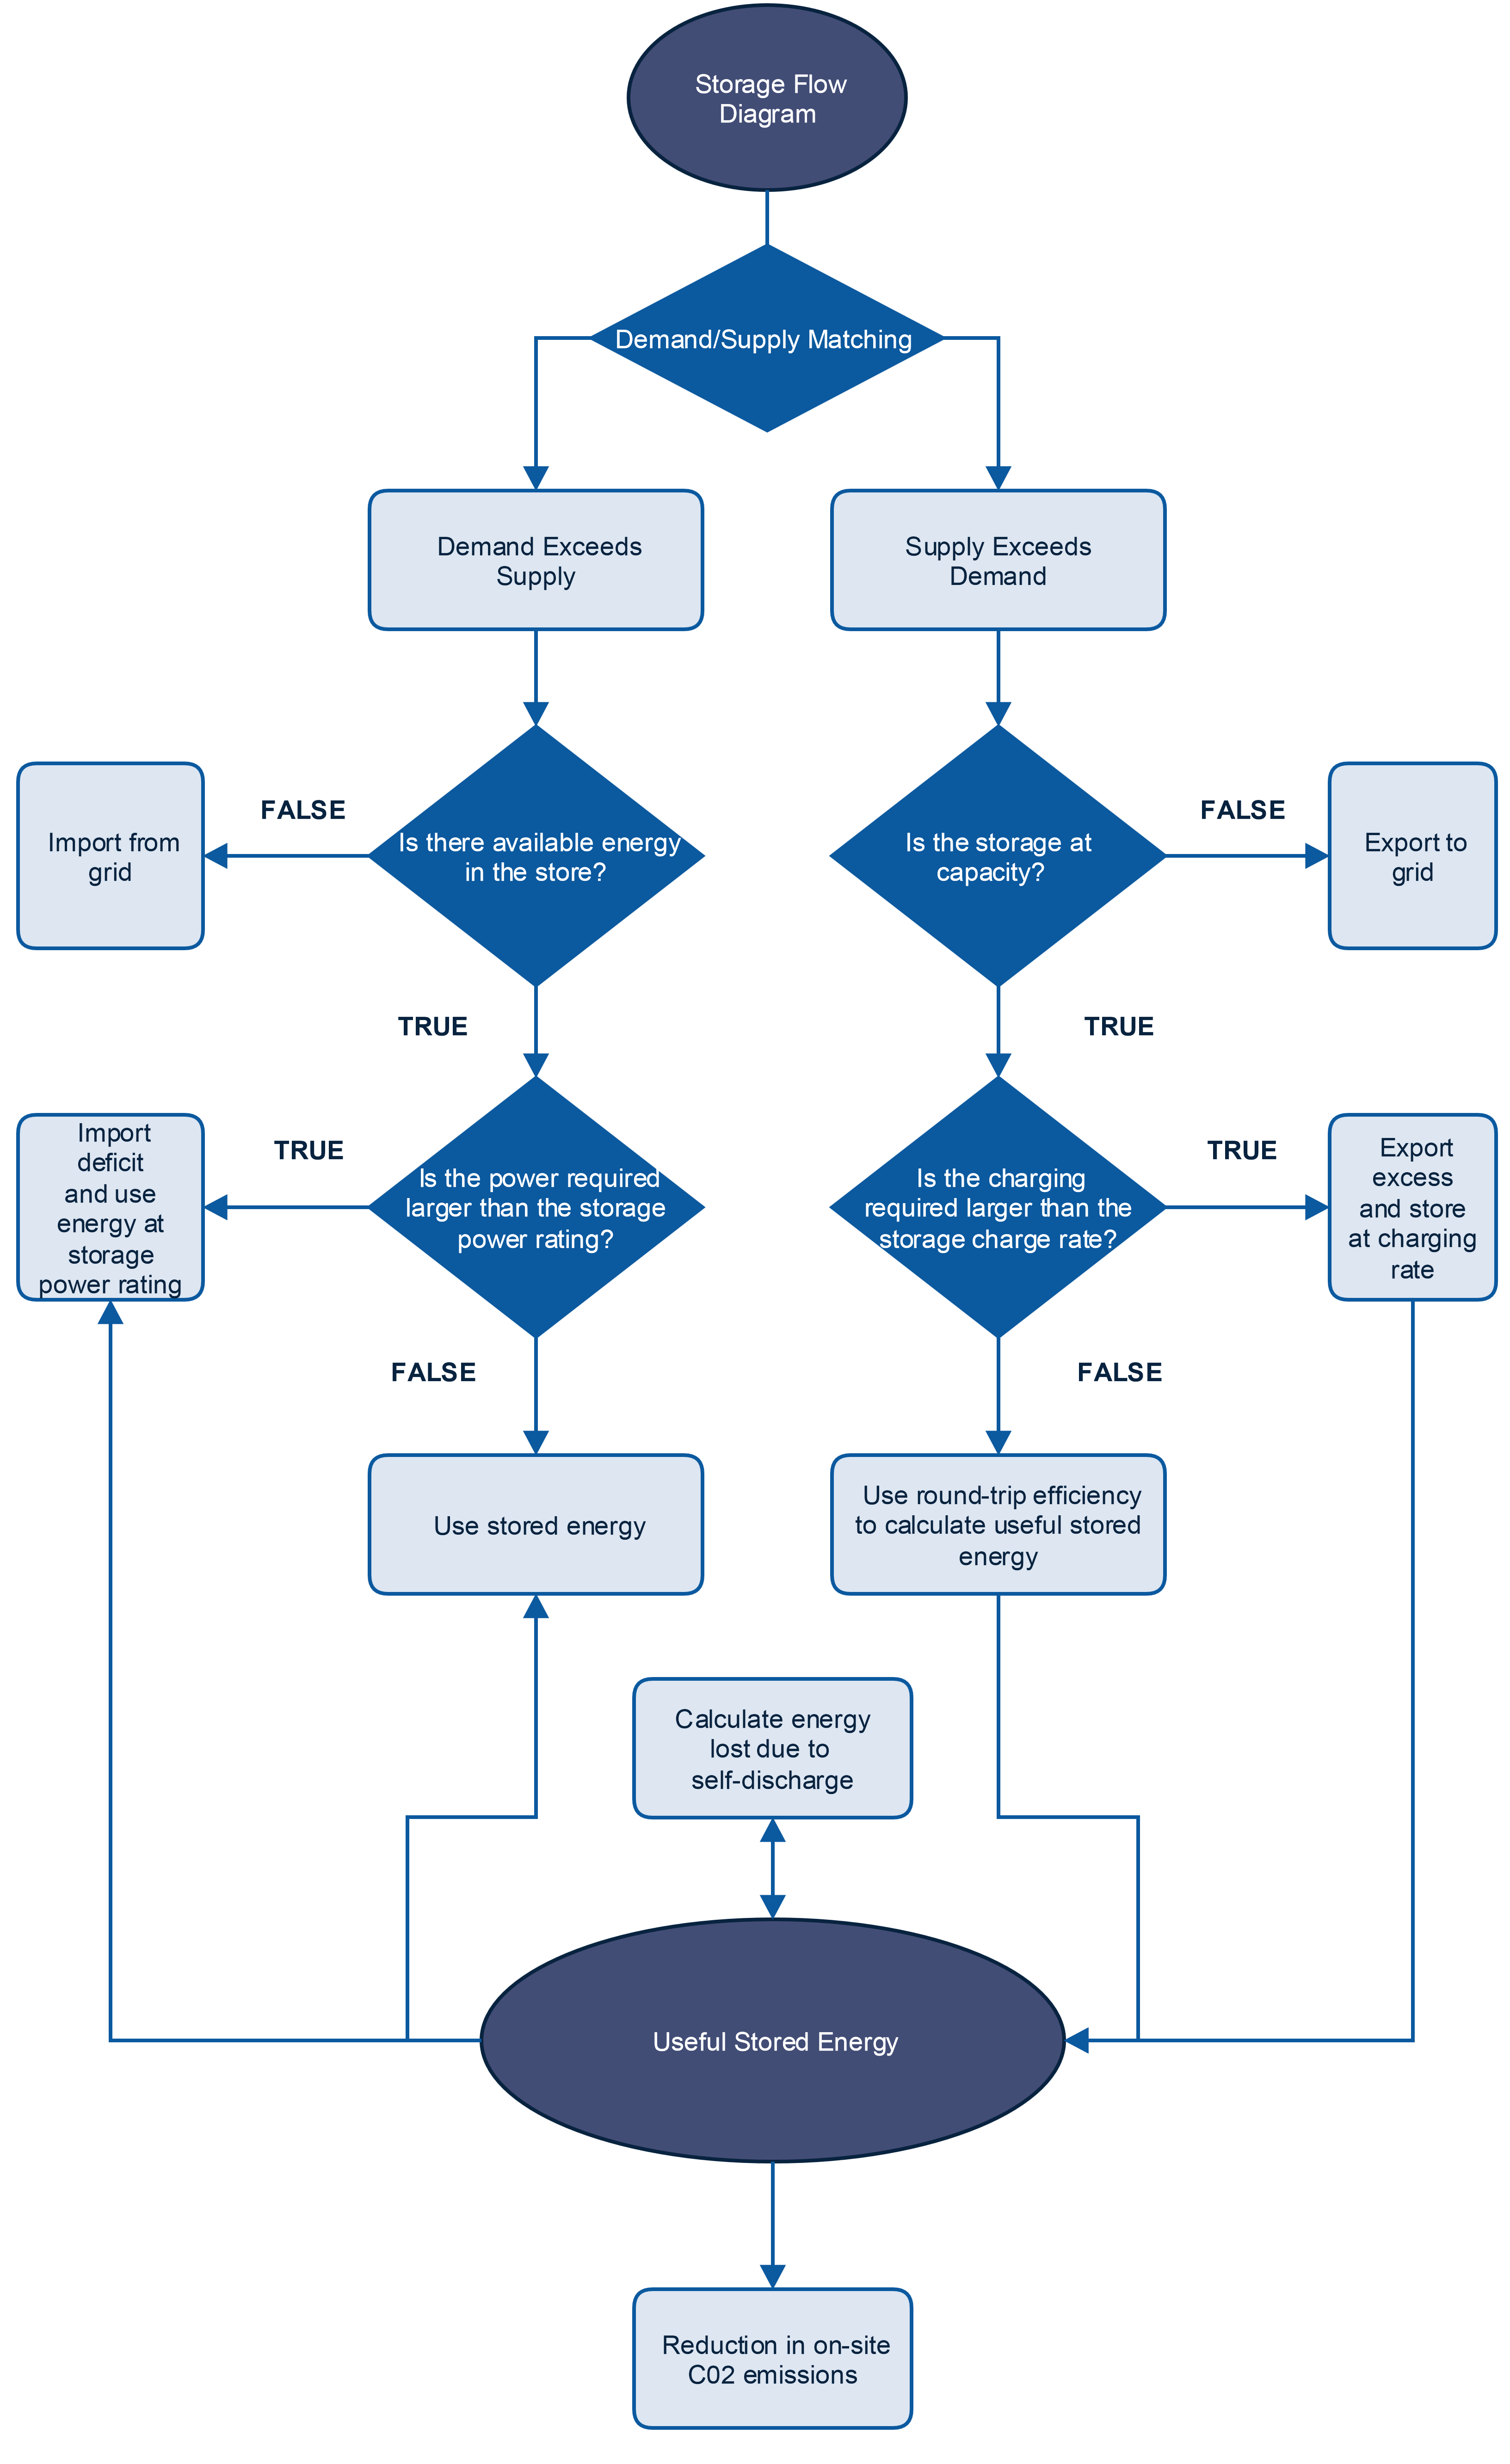
A flow diagram was developed to provide a graphical representation of the calculations performed by the model for each hour over a year. In this section we will detail each section of this diagram to provide insight into how the model was created. The full diagram is available at the end of this page.
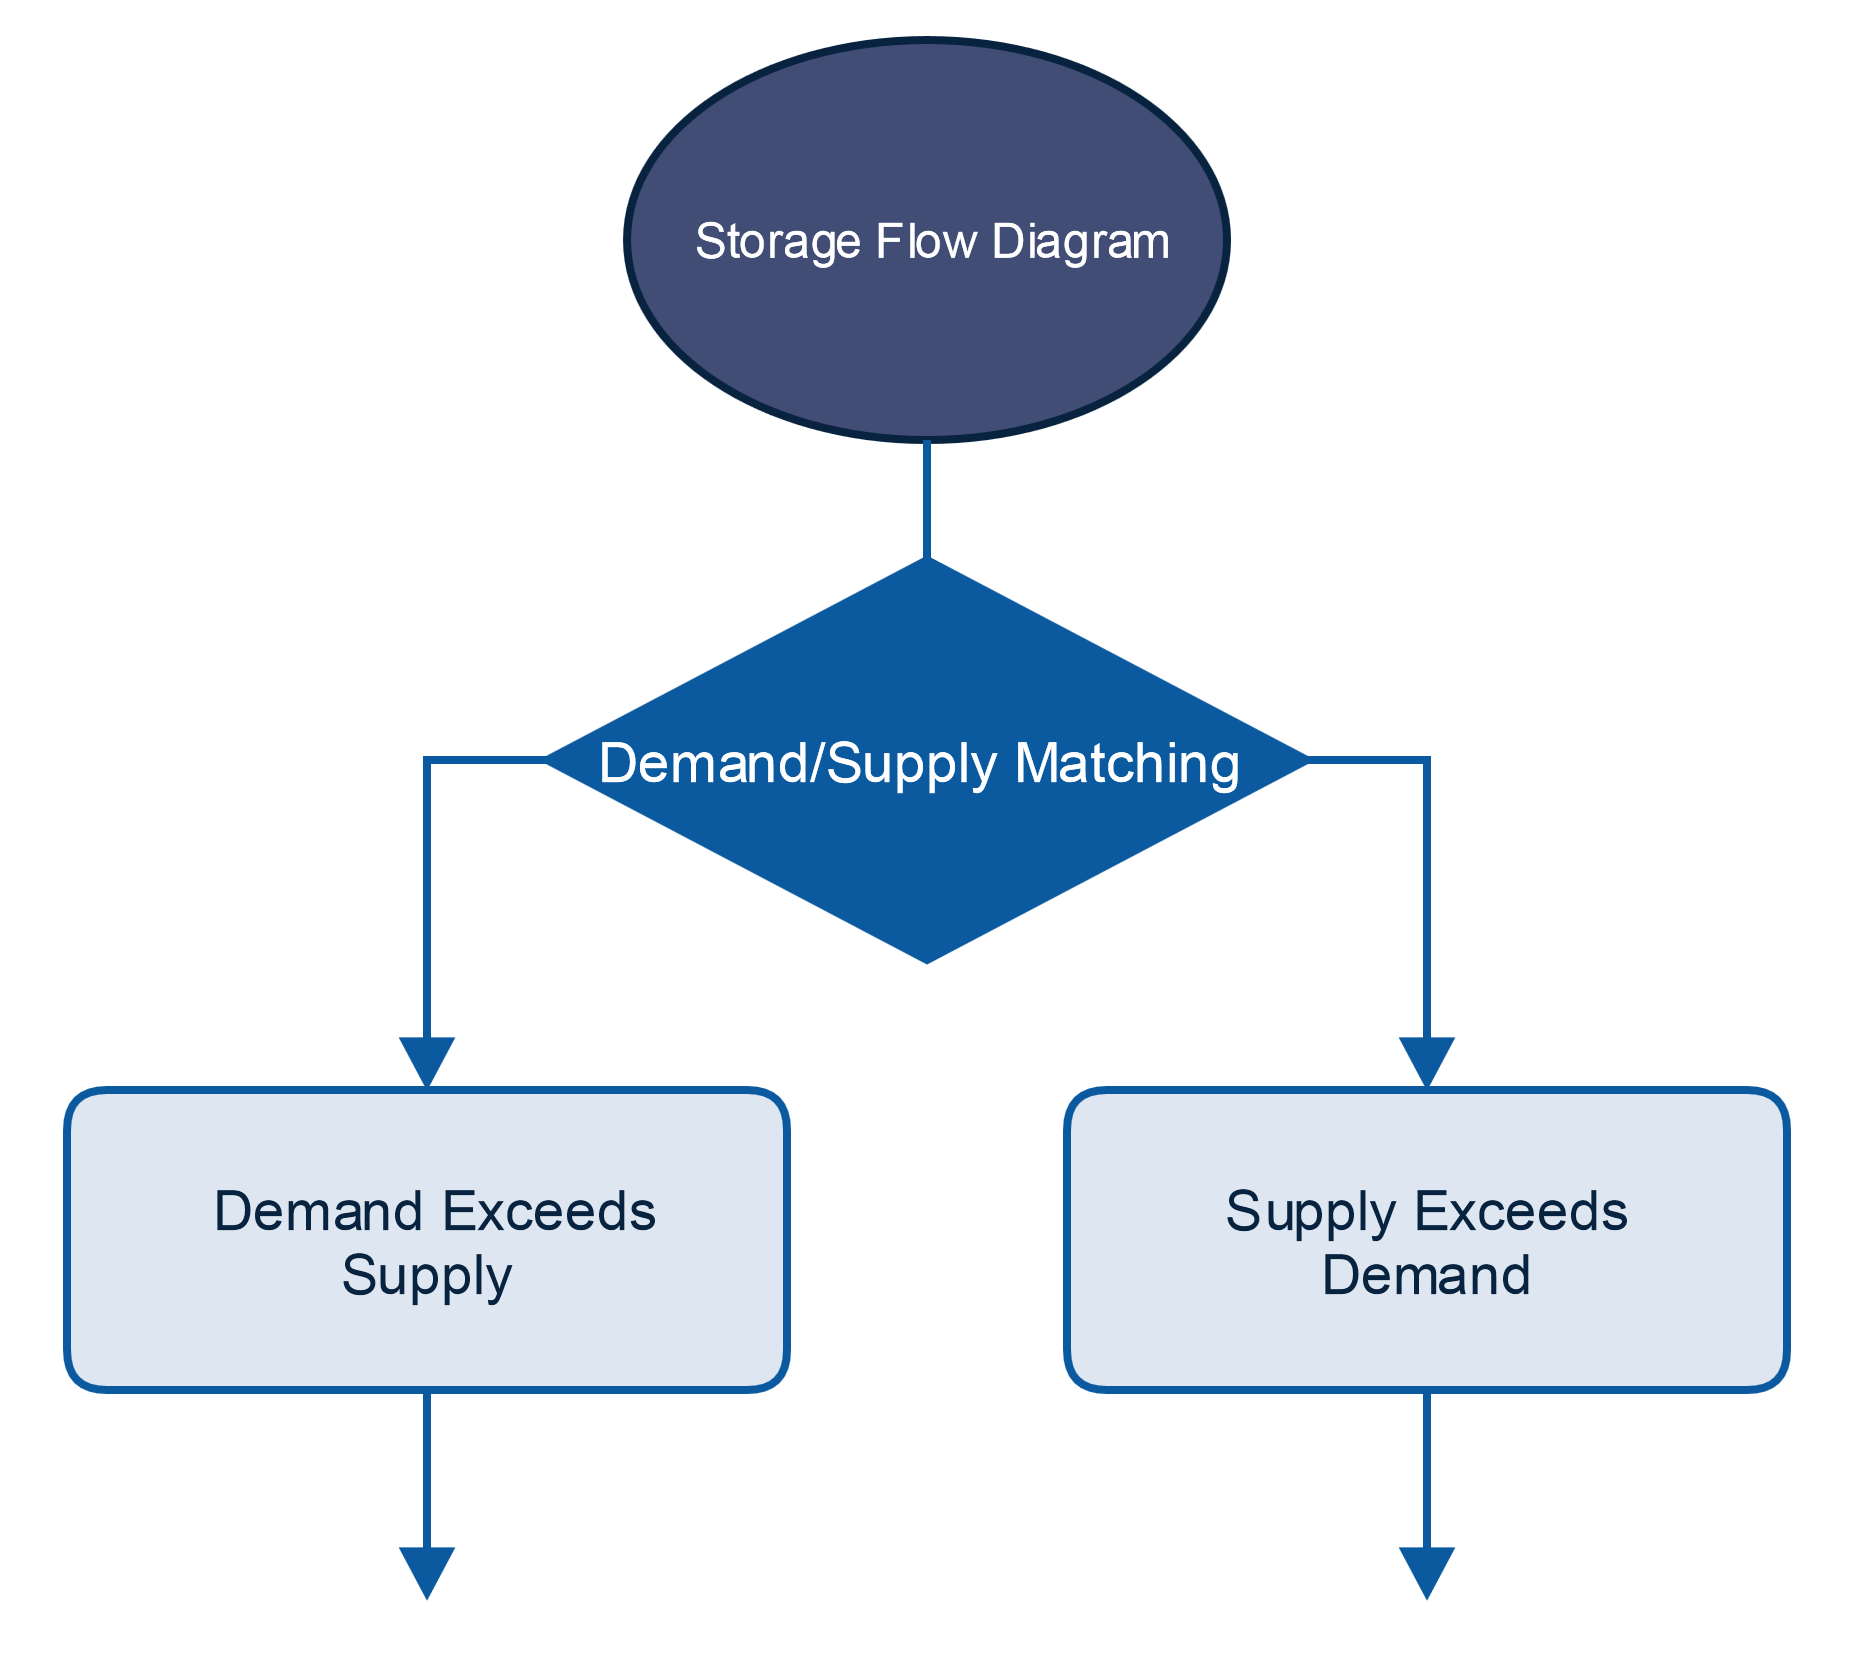
As described in the “Tool Specifics” section the analysis starts with demand/supply matching. The flow diagram then diverges into two branches: where the demand exceeds the supply, and where the supply exceeds the demand.
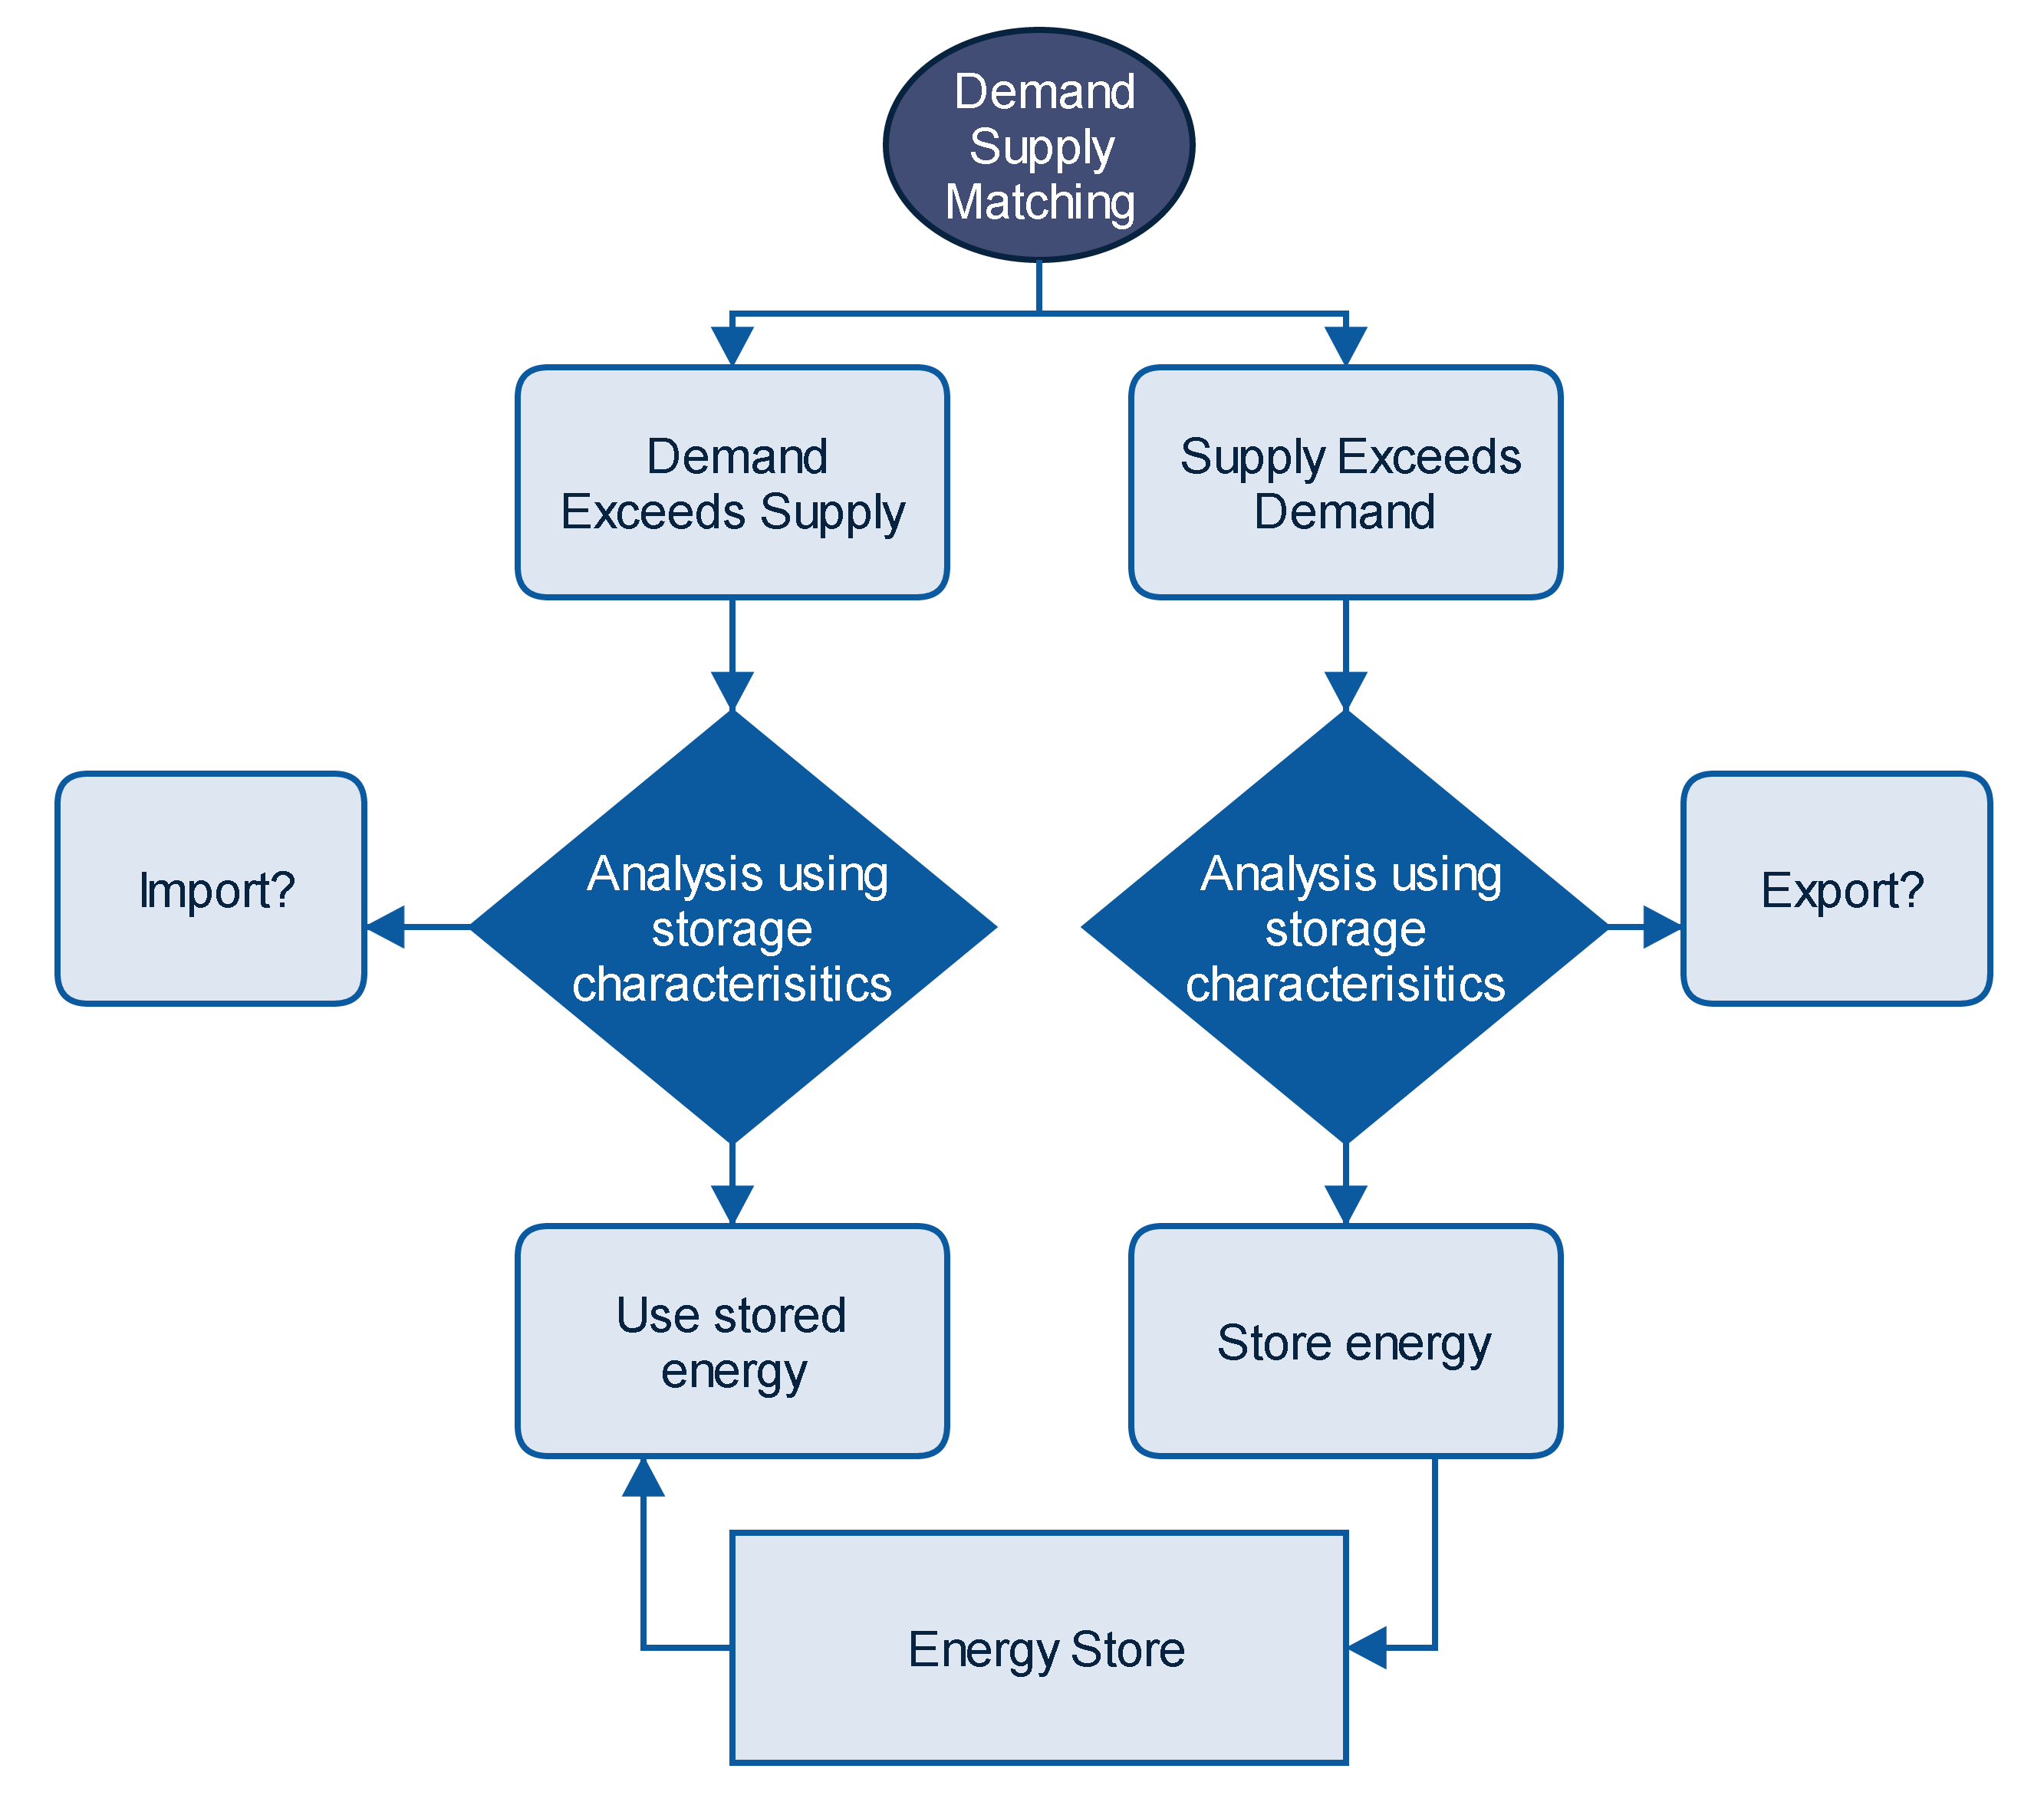
This simplified version of the flow diagram shows what is being calculated in both the branches. Where the demand exceeds supply the model calculates how much energy needs to be imported and how much of the previously stored energy can be used to meet the demand. Where the supply exceeds the demand the model calculates the energy to be exported and the energy which can be inserted into the storage technology. The energy storage has its own place on the diagram to represent that the storage is the link between the two branches. The diamond is where the analysis is performed which requires the inputs from the storage characteristics of the specific technology to be investigated.
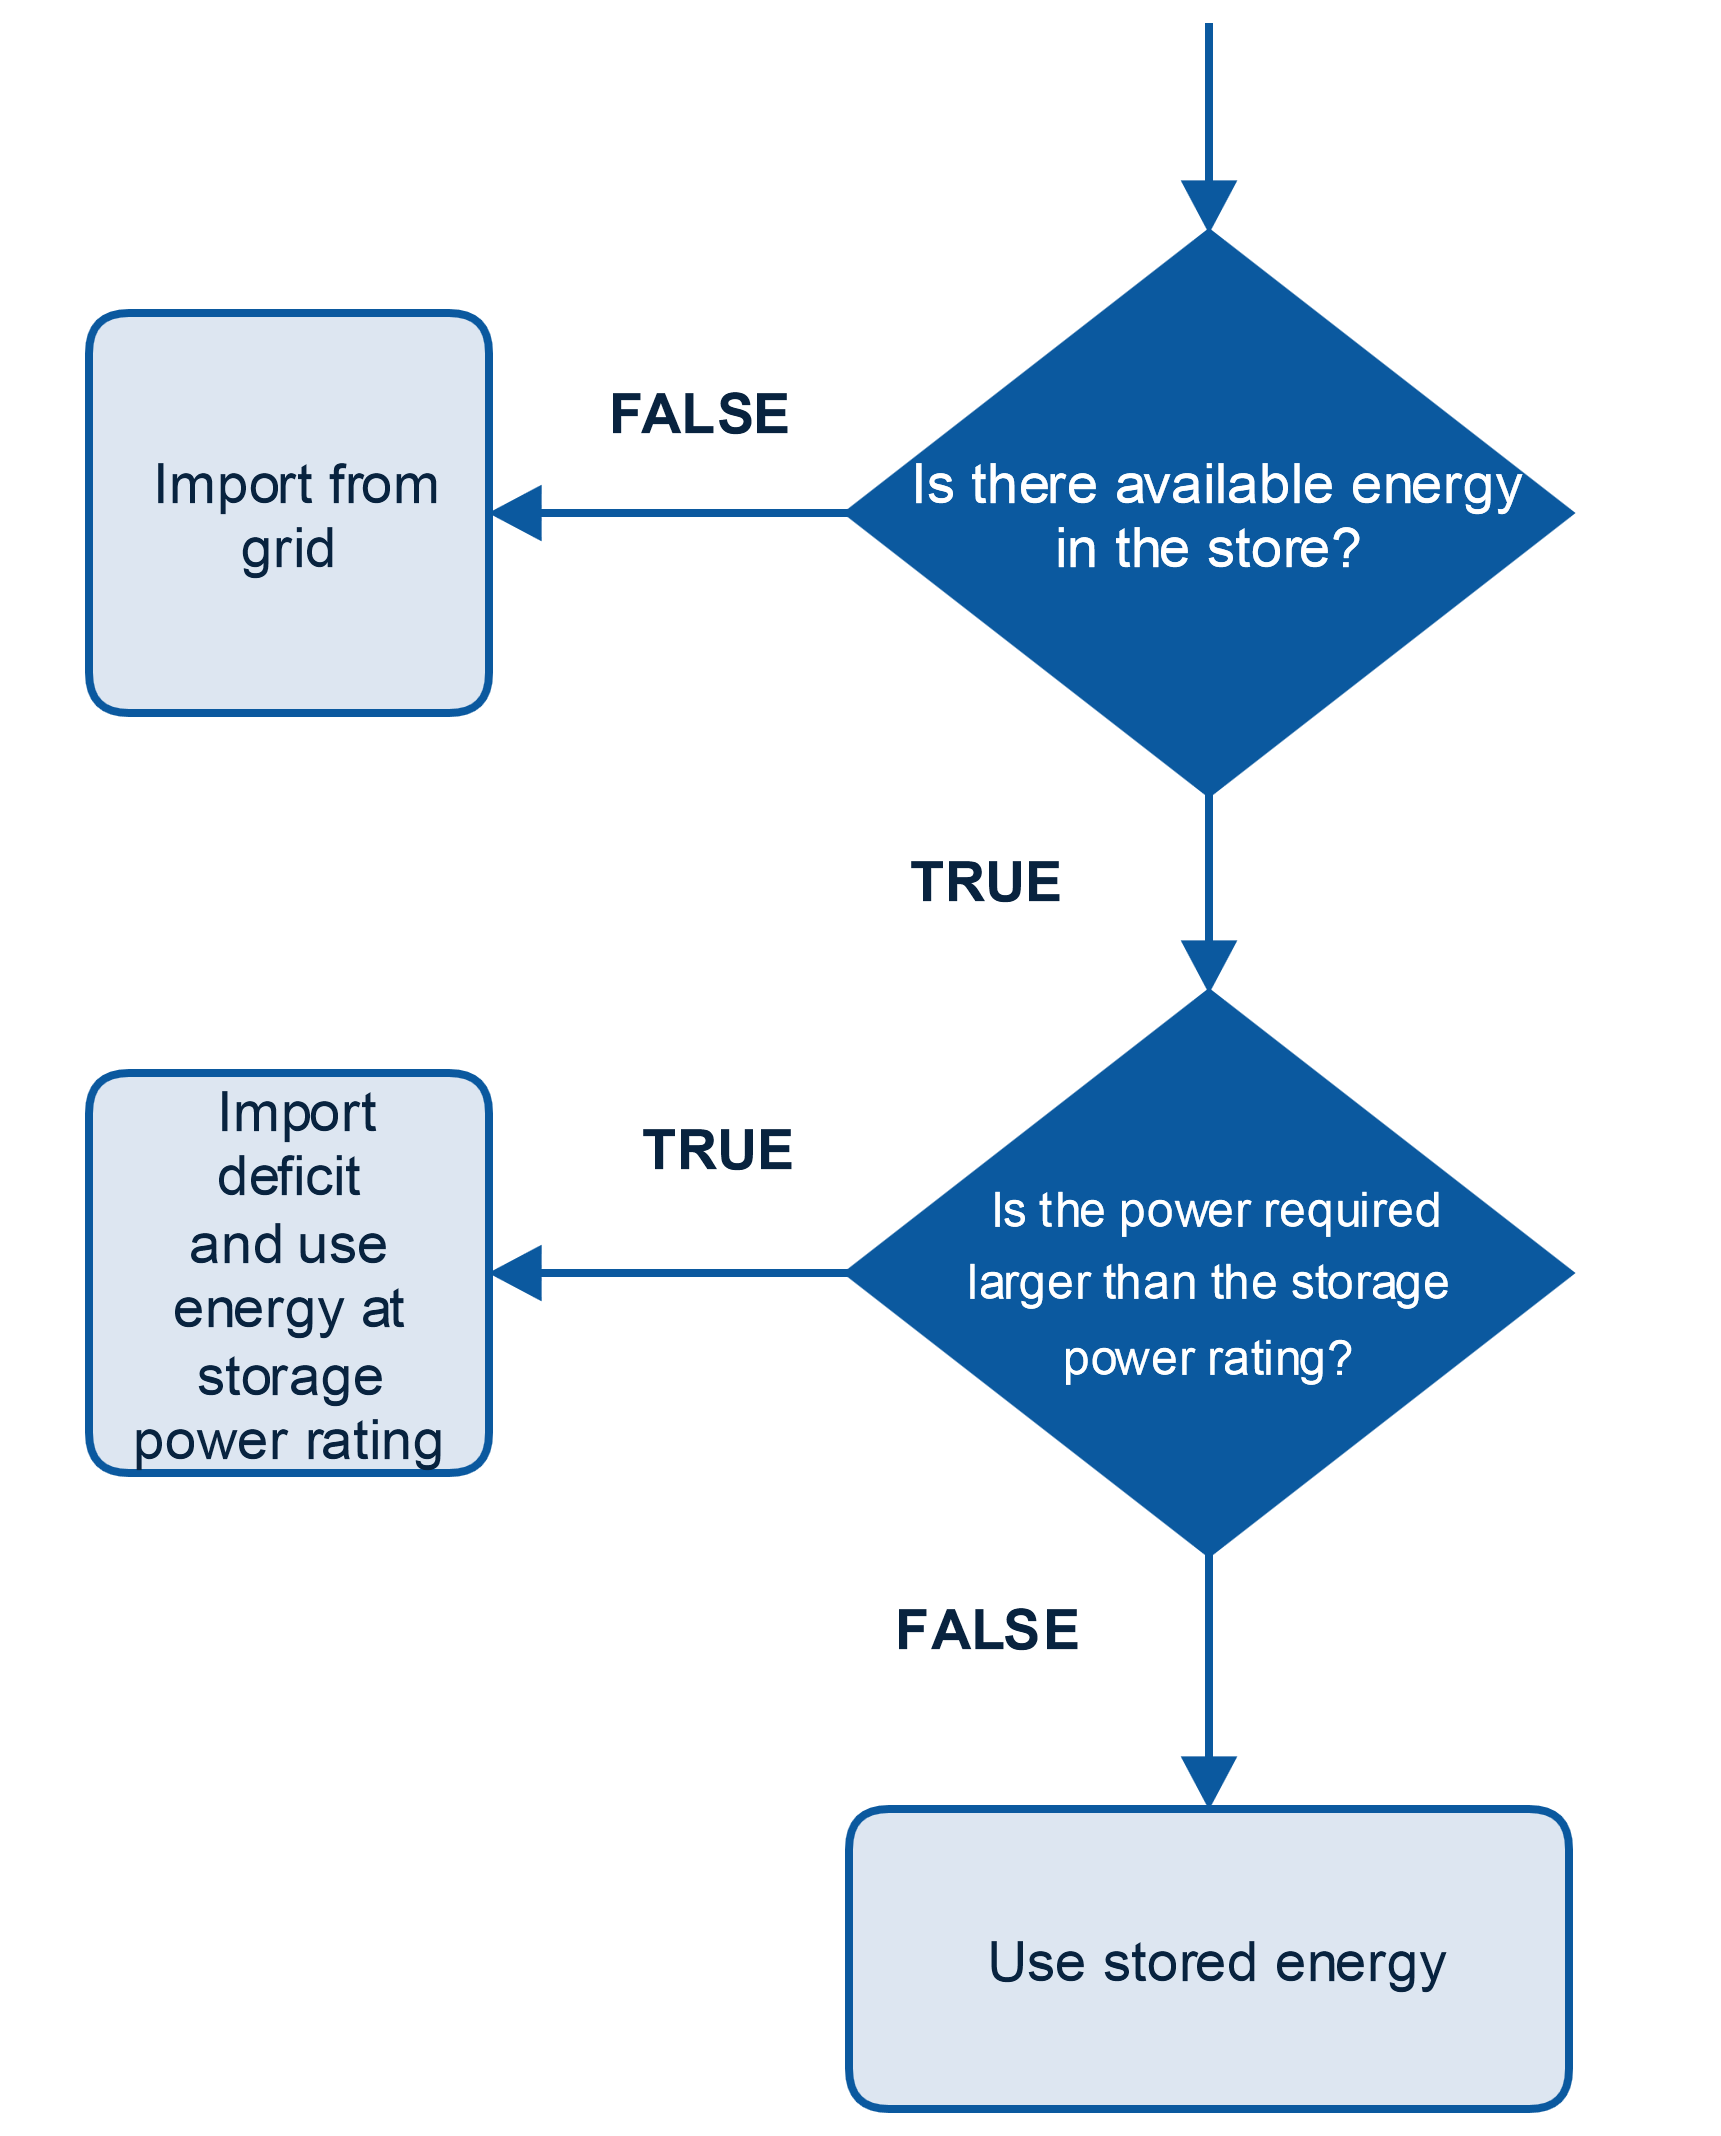
This section of the flow diagram is for where the demand exceeds supply. Following the true/false questions provides the model with the data required to calculate how much energy to import and how much to use from the storage.
It is assumed that the power rating is constant, independent of how much energy is stored at any time. In reality this would be a more complex function and would be distinct for different storage technologies.
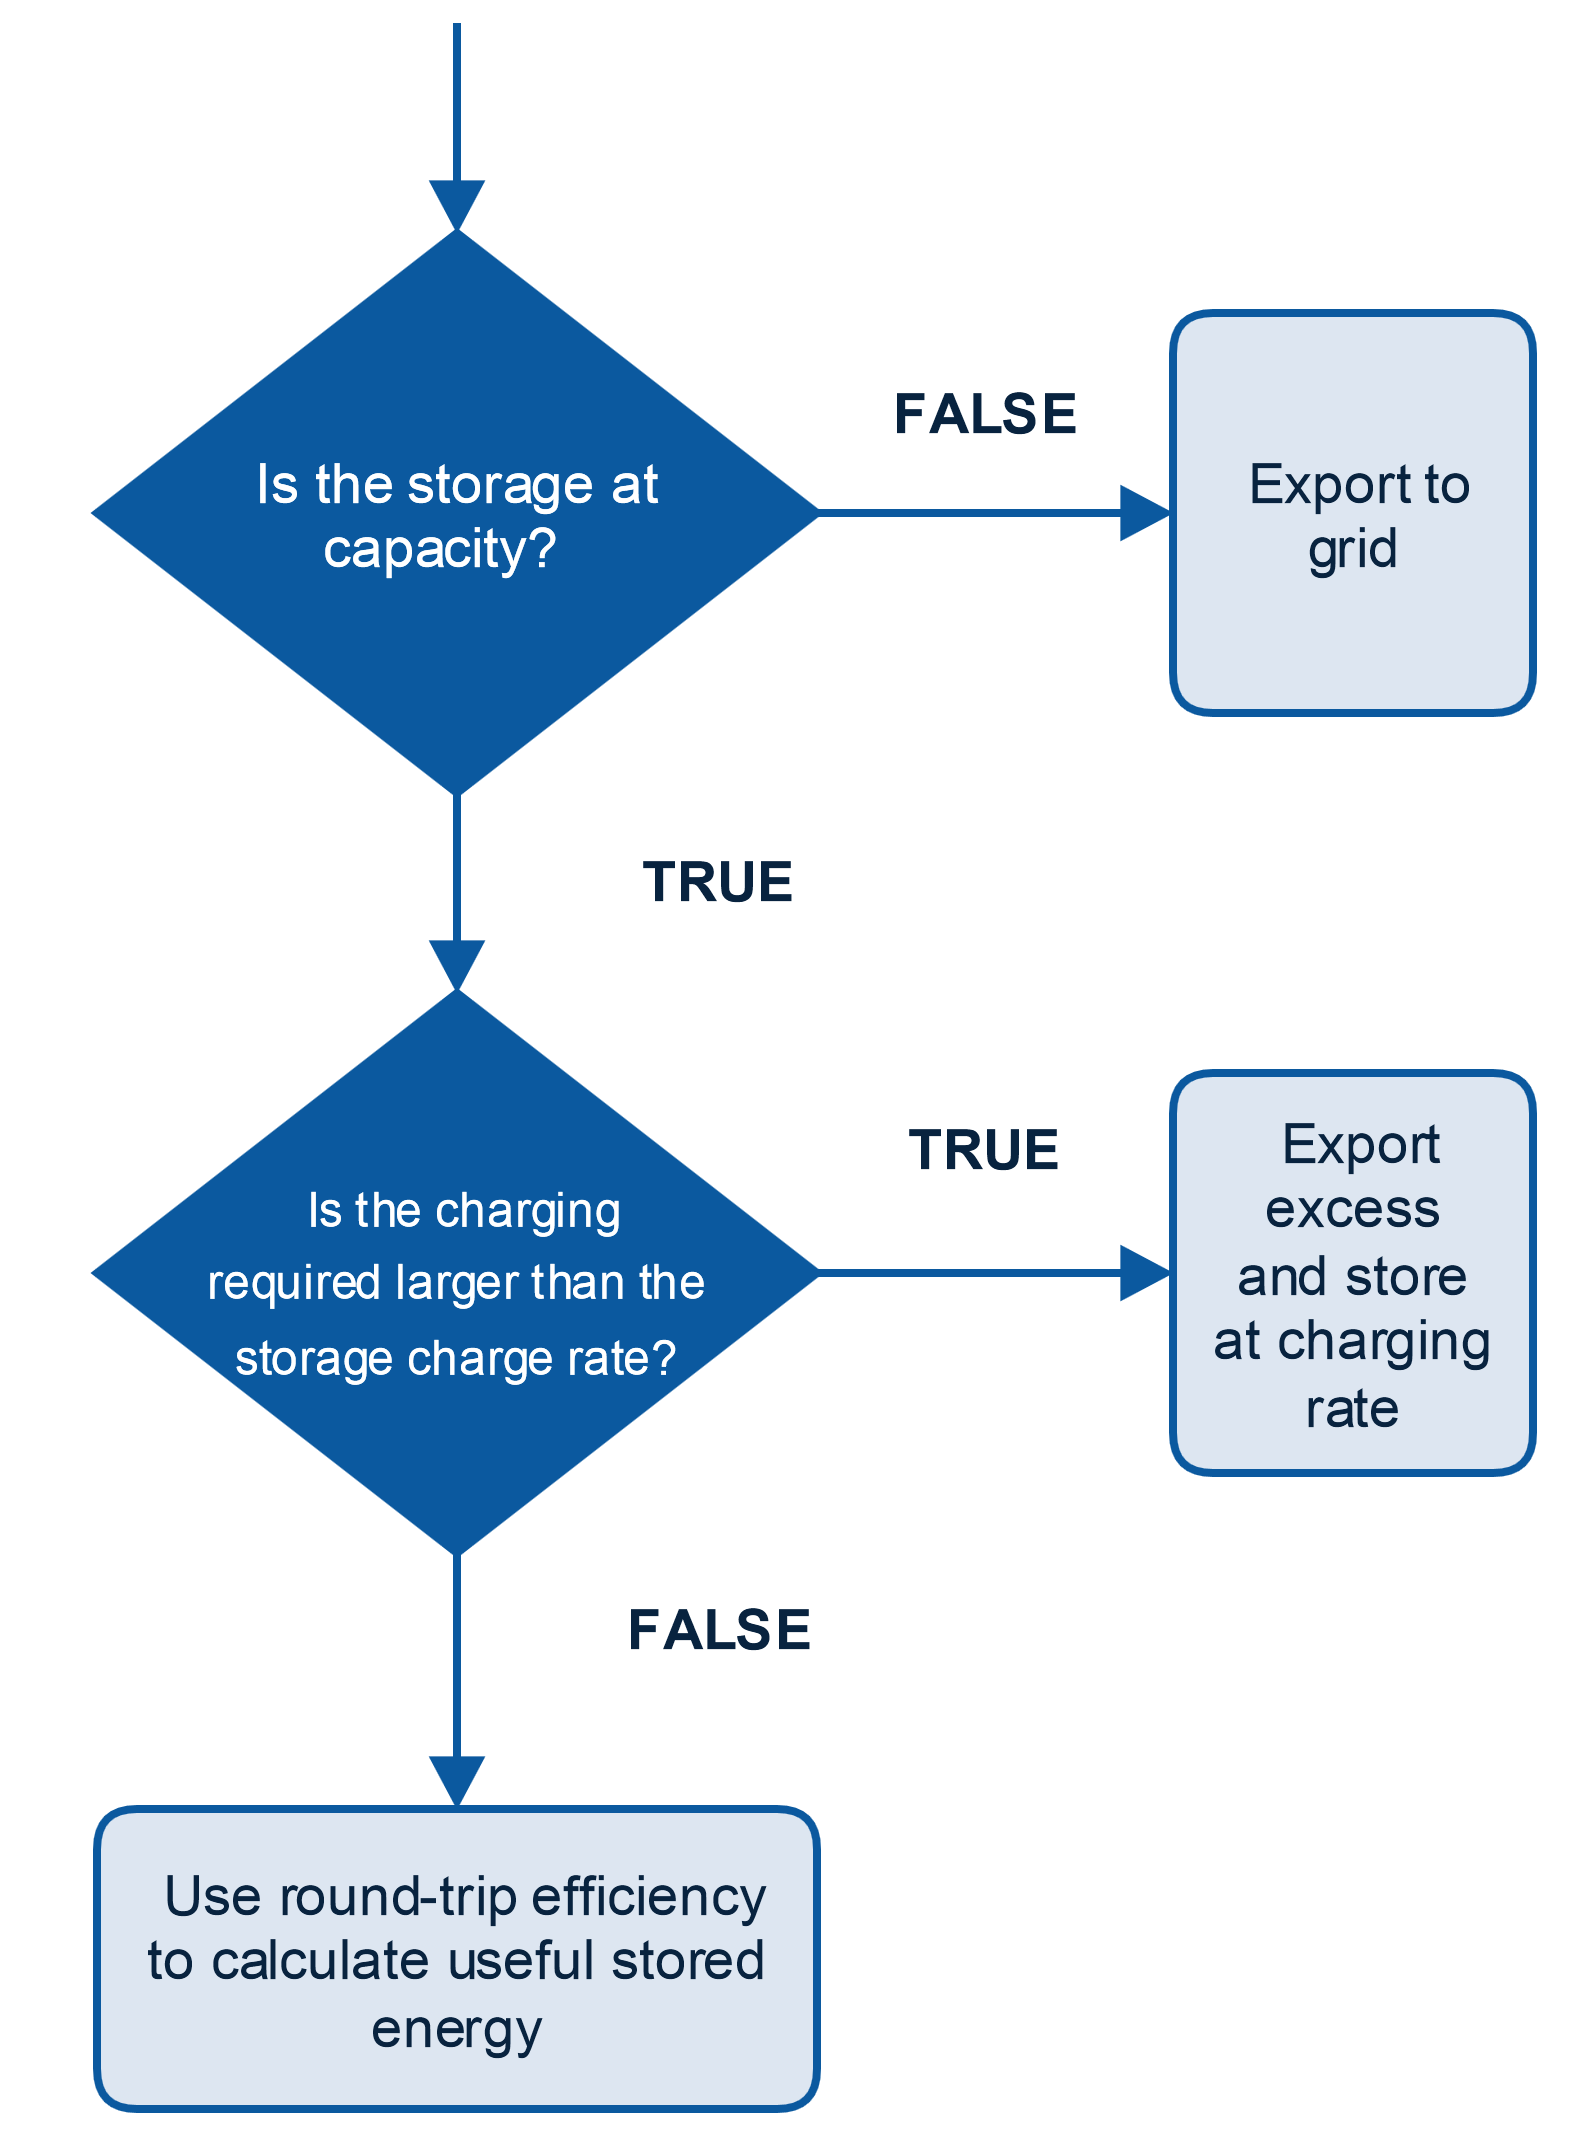
This shows where the supply exceeds demand. Following the true/false questions allows for the calculation of how much energy is exported and how much can be put into storage.
Similar to the power rating, the discharge rate is also taken to be constant. This should also be a complex function, as there are many external dependencies such as thermodynamic variations and how much energy is already contained in the device.
Below is the full flow diagram, including the emissions reduction and self-discharge. The emissions calculator looks at the reduction in imports due to the implementation of an energy storage device to calculate the on-site reduction in C02 emissions. The self-discharge is taken directly from the energy stored from the previous hour.
