The inputs required are the industrial demand profile, the various on-site generation output profiles and the specific characteristics of the storage technology to be investigated.
The industrial demand profile required is the hourly electrical demand over an entire year for the entire plant. The shape of this demand profile is an important factor in how a storage device performs. Therefore it should not be taken as a flat load over the year, the variability is vital for the analysis. It has been assumed that this entire demand needs to be met such that there is no demand side management to mitigate against scenarios such as a grid blackout.
The different on-site generation output profiles are inserted separately so that the model can combine them to provide a total on-site supply profile. Generally such generation is either static or variable. A static supply can be given as the entire output for the year, which the tool then converts to an constant hourly output. Variable supply options should be provided hourly to provide an accurate representation of the intermittency. It is important to consider that static supply options are often not entirely static, due to incidents such as trips where the supply is cut out for a short time period. Due to the importance of profile shape for further accuracy it would be better to provide real data for all the supply options, not averages.
With both the supply and demand profiles now entered the tool can perform demand/supply matching. This is shown graphically as a simple graph of the comparison of the accumulation of the different supply options power output against the power required for the demand. The residual also shows the difference between the two, with a positive residual signifying where there are exports and a negative residual being the imports.
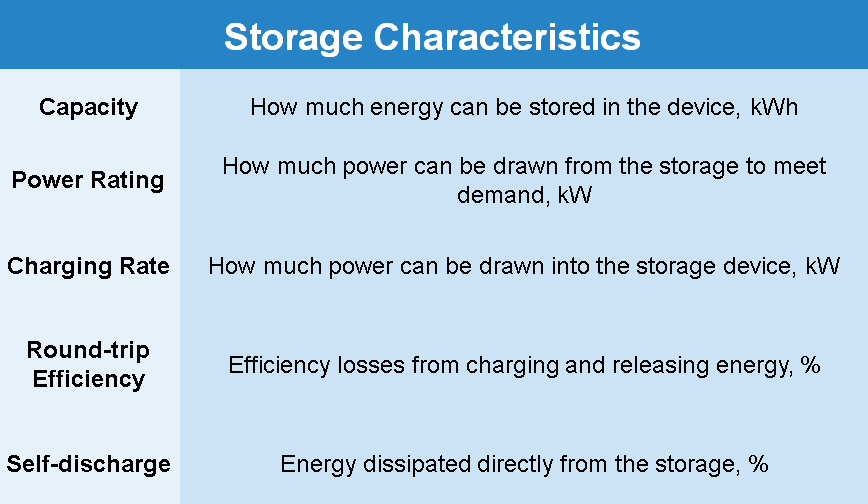
The next step is defining the storage technology which is to be analysed. They are determined by their technical characteristics, the table below outlines these.

The model takes these to perform the necessary calculations described by the flow diagram in the next section.