Results from the Technical Assessment
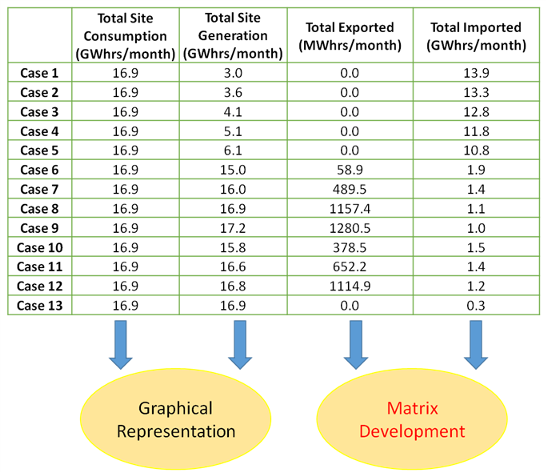
The modelling subsection shows an example of one of the cases with the respected data and outputs. The table below shows the results obtained from each case under the same modelling format. The table contains some key information that was used to develop the overall metrics which can be seen in the figure below. The tool that has been used for this assessment is also available in the Links/Download section of the conclusions to the project. The results below only show the data and outputs from the technical data alone (see economic section for the financial data). The table shows each respected case with site consumption, generation and the total amount of power exported and imported from/to the GRID network. From this it was then important to look at the results graphically and see what outputs we had from each respected case as well as obtaining results for the final assessment matrix.
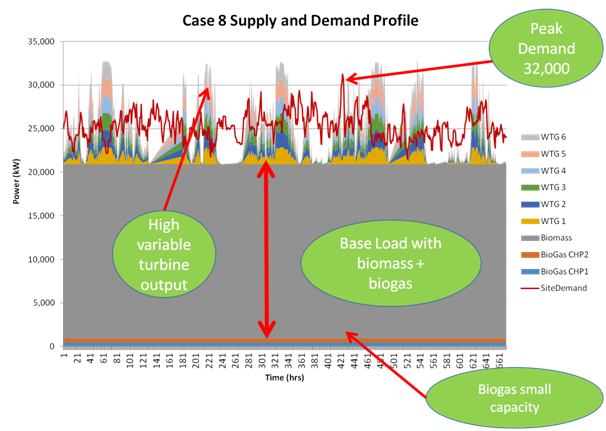
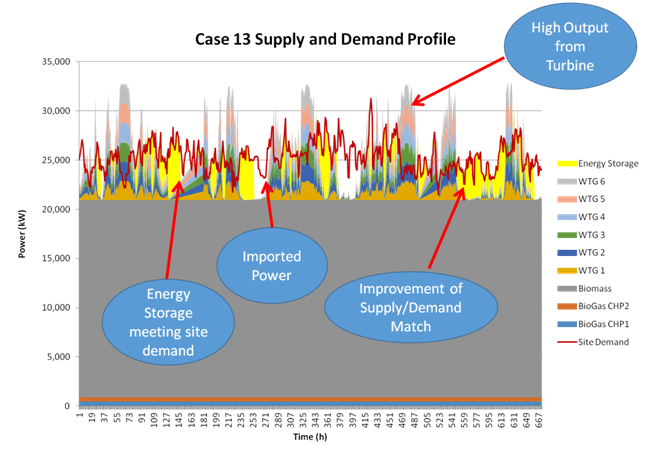
The graphs below show results from two example cases.