Grid Considerations
To determine suitability of grid connecting a battery, information was gathered on parameters that have to be considered in the software.
- Physical connection
- Components e.g. rectifiers and inverters
- Performance
- Discharge time
- Legislative parameters (G59 compliance)
Wind Speed Data
|
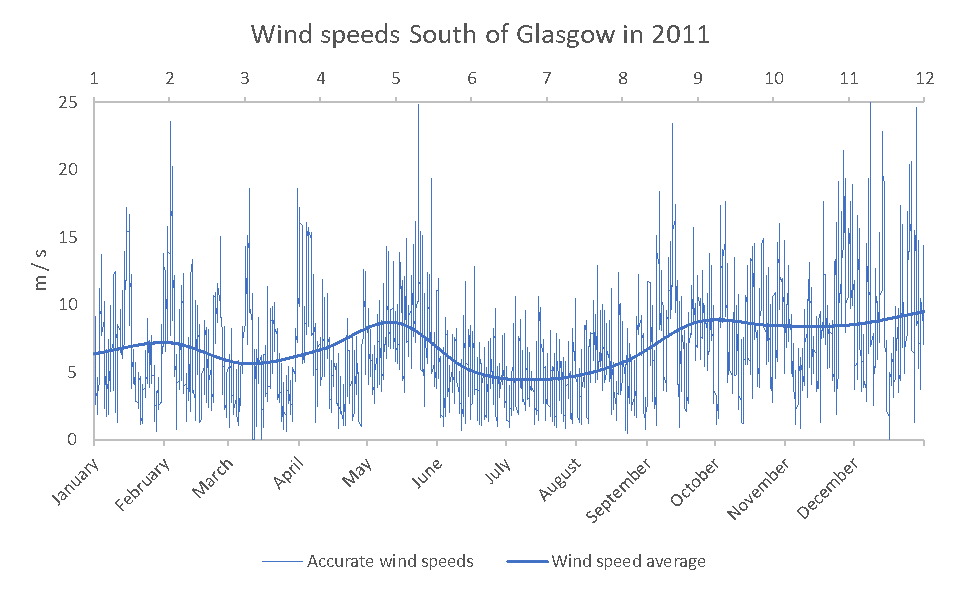
To calculate the power output of the wind turbines, site specific wind speed data was used. The wind data gathered was suitable to be applied to both the small scale investigative site and the large scale site.
Data was obtained from a local weather station measured using an anemometer at 50m high. This was the highest height of measured wind speed and therefore would give the most accurate results of the wind speed experienced by turbines on the site. 2011 data was utilised as this was the data obtained that was the most accurate. The graph on the right shows the calculated wind speeds for 2011. The data was extracted at 10 minute time steps and these increments were then averaged to represent 30 minute increments which were more suitable for analysis. The deep blue line on the graph indicates the overall average wind speed which for 2011 was 7 m/s. The peak wind speeds were measured in the winter months of 2011. |
|
Wind Turbine Data
To ascertain accurate power output and dimensions for each onsite turbine, data was sourced from published manufacturer specifications (where available).
Whitelee Windfarm has 215 installed turbines.
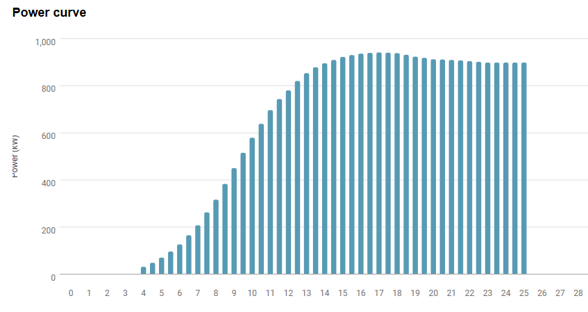
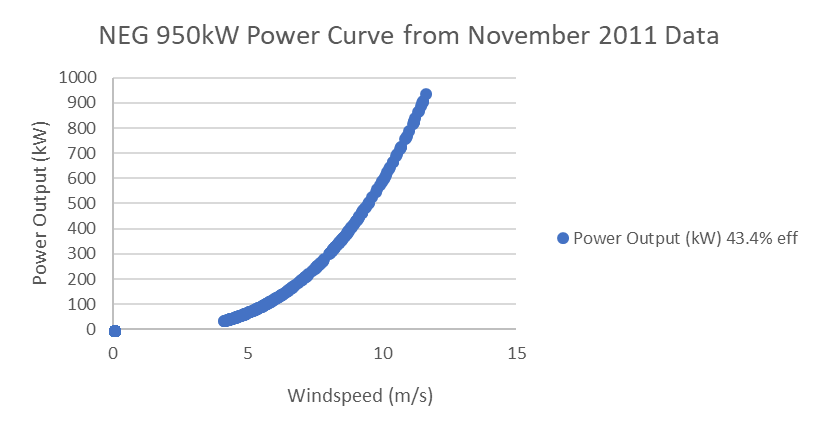
Myreshill has 2 x NEG Micon 950 kW NM54/950 turbines. [2]
Below is a representation of the Power Curves of the NEG 950kW turbine from 1. the manufacturers data and 2. the calculated output in November 2011 given the accurate wind speed data.
Whitelee Windfarm has 215 installed turbines.
- 140 x Siemens 2.3MW 101 turbines
- 69 x Alstrom 3MW Eco 100 turbines
- 6 x Alstrom 1.67 MW Eco 74 turbines
Myreshill has 2 x NEG Micon 950 kW NM54/950 turbines. [2]
Below is a representation of the Power Curves of the NEG 950kW turbine from 1. the manufacturers data and 2. the calculated output in November 2011 given the accurate wind speed data.
https://www.thewindpower.net/turbine_en_736_neg-micon_nm54-%20950.php
|
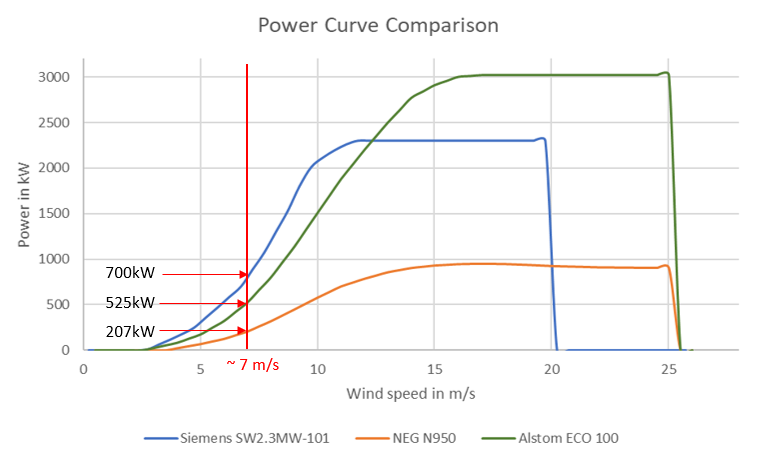
A comparison of 3 of the power curves analysed was made. The graph on the left shows a representation of the 3 curves:
The red line on the graph shows the average wind speed of 2011 which was measured to be 7 m/s. At 7 m/s the outputs are:
Interestingly, the larger output turbine (Alstom) actually performs worse at the average speed of 7 m/s than the smaller 2.3MW turbine. |
|
Storage Parameters
To calculate battery specifications and performance within the system, manufacturer published data was used.
2 battery systems were simulated:
The data for ammonia generation and potential power output was based on enclosed research. [3]
2 battery systems were simulated:
- the Tesla 210 kW LiIon Powerpack2 battery
- the Red T 300kW 60-300 Vanadium Redox Flow battery.
The data for ammonia generation and potential power output was based on enclosed research. [3]
Load Profiles
To determine accurate electrical load profile requirements of the system on an annual, hourly resolution basis the UK daily household average consumption of 9 kW/h was used. From this average an hourly load distribution was generated in Homer Pro software.
- The Myres Hill load profile was based on the consumption of 300 households with the same diversity factor.
- The Whitelee load profile was based its rated capacity of the consumption 300 000 households at a diversity factor of 70%. [4]
|
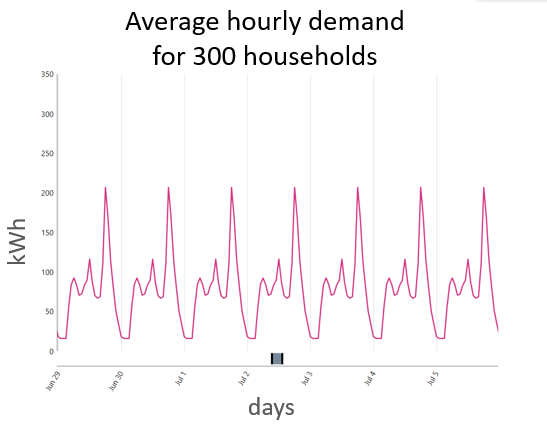
Above is a representation of the daily demand throughout a Summer week period for around 300 households. It is clear that the daily demand is similar for all days of the week in this profile.
|
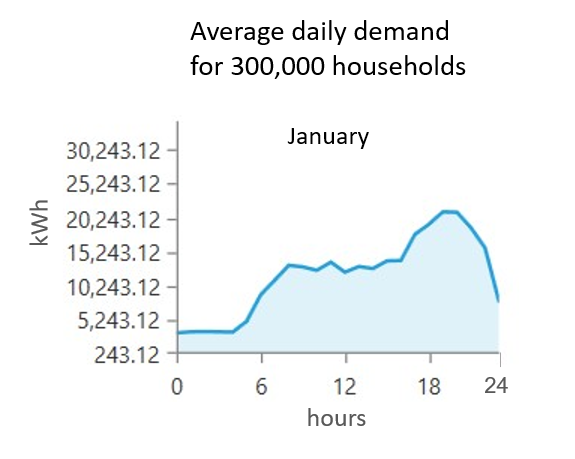
The graph above shows the demand distribution over the course of 1 day in January, highlighting the peak is around 7pm and the lowest demand is through the night.
|
Outputs
Power Output
The power output of the turbines and storage options was calculated manually with Ms Excel algorithms and the same data was used to conduct system simulations in Homer Pro software.
Verification
Manual and simulated results were compared. Both results for power output from the turbines was verified with official Ofgem published output data for both sites. [5]
Background header: https://medium.com/@ImpetusResearch/top-5-data-collection-companies-in-india-4c4f4298451b
[1] www.pndc.co.uk
[2] www.usa.siemens.com/.../_resources/pdf/Siemens-SWT-2.3-101_Print.pdf
[3] www.renugen.co.uk/...brochures/...brochures/Alstom-Ecotecnia-ECO100-3MW-Wind...
[4] www.alstom.com/Global/Group/Resources/Documents/.../file_53161_173906.pdf
[5] www.thewindpower.net/turbine_en_736_neg_micon_nm54-950.php
[6] https://www.tesla.com/en_GB/powerpack
[7] https://redtenergy.com/products/product-specs/#download-file
[8] www.homerenergy.com
[9] https://www.ofgem.gov.uk/
[10] www.variablepitch.co.uk