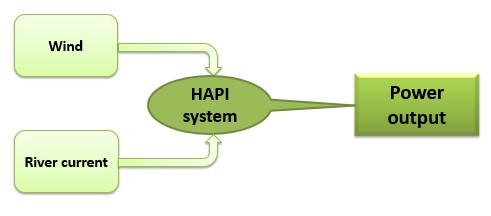
power OUTPUT |
|
Selection of wind turbine
|
The selection of the wind turbine was mainly based on the wind resource analysis of the site. Αnother decisive factor was its total height and weight, which were carefully considered so that the stability of the system would not be endangered.
The turbine is of a horizontal axis (HA) type, upwind style and has a nominal power output of 100 kW. It is developed by C&F Green Energy [1] and it is shown on the picture below. 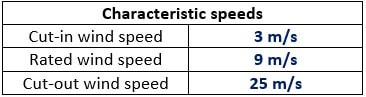
Table 1: Characteristic wind speeds
|
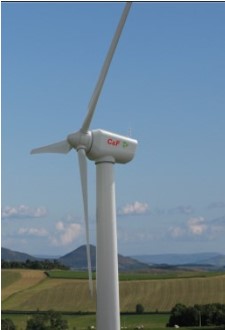
Figure 1: CF 100kW [1]
|
Wind resource analysis and energy generation
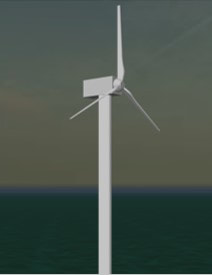
Figure 2: Wind turbine design
|
The first step to calculate the energy output of the wind turbine comes with the analysis of the wind data from the chosen site. Data about the wind distribution direction was obtained from windfinder.com [2] and based on that we found the suitable positioning of the wind turbine, so that it is turned to the main direction of the wind. Also, the frequencies of occurrence of wind speeds measured at 10m above ground level nearby our location were acquired by works of [3], [4] and [5]. Since the rotor of our wind turbine stands in 30m AGL, the wind speeds had to be transposed to this height [6] to be able to perform statistical analysis and finally calculate the annual energy output.
|
To do so, we firstly formed the Weibull distribution from which the cumulative distribution function could be derived:
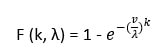
The parameter k is called shape parameter, λ is the scale parameter, while v represents the wind speed. Through Matlab the function parameters were computed and the following results were extracted:
k = 1.89 and λ = 7.89 m/s
k = 1.89 and λ = 7.89 m/s
The next step was to produce the wind exceedance curve which represents the number of days per year which the wind speed exceeds a specific value. By integrating the area between the days that correspond to the cut-in wind speed and those with respect to the cut-out wind speed (red area in the graph), we can calculate the average annual energy output of our wind turbine and consequently, its capacity factor.
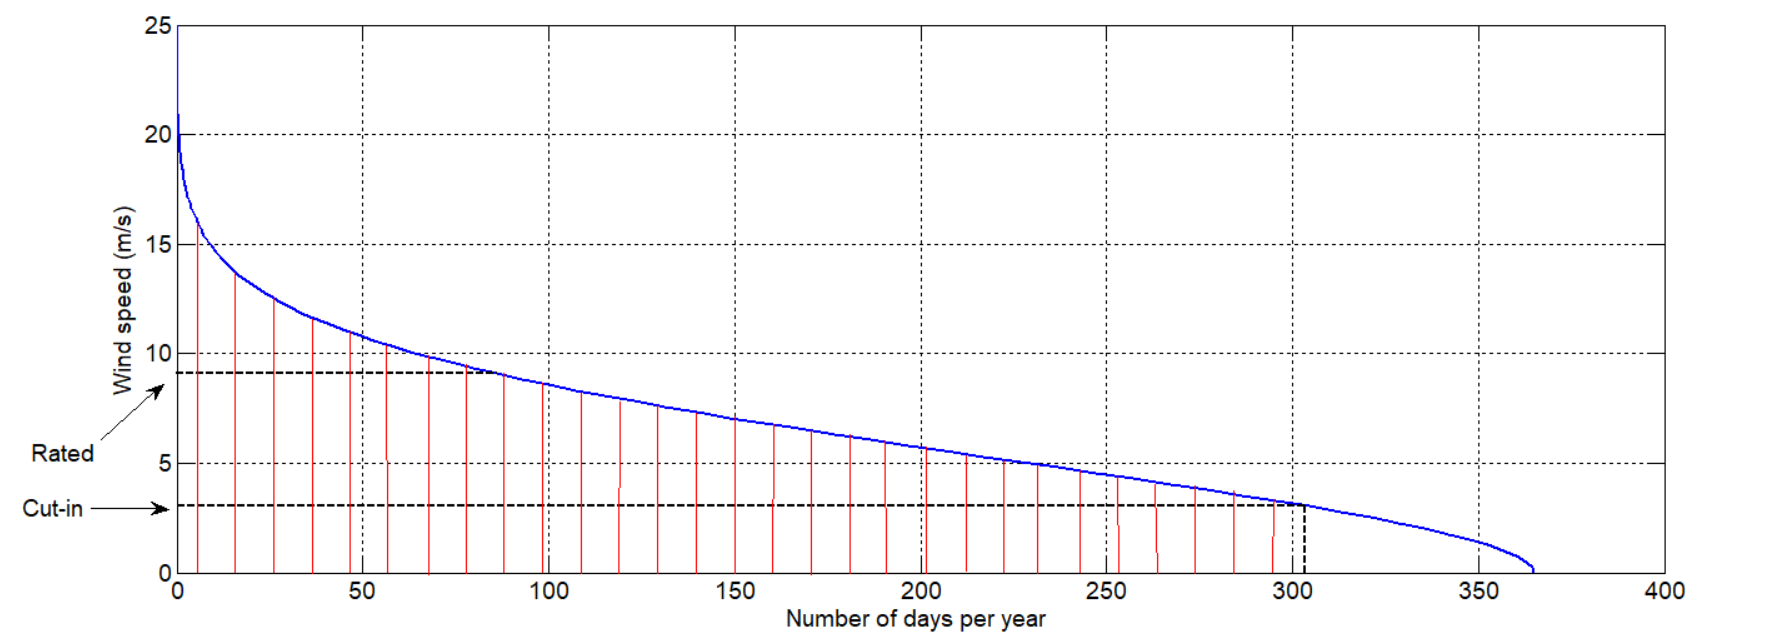
Figure 3: Wind exceedance curve
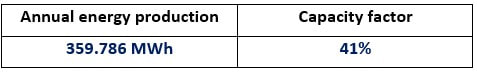
Table 2: Energy generation and capacity factor for the wind turbine
Selection of river current turbine
|
Given that the mean annual current speed in this part of the river reaches 0.8 m/s, as measured by the Nile Research Institute, and due to lack of data regarding its variability throughout a year, we selected to use multiple current turbines of relatively low rated power output instead of one with higher power capacity. The reason behind this decision lied on the power curve of the turbine; a current turbine which would have nominal capacity of 20 kW would never actually generate more than 2 kW in this area, because most of the time it would not operate under its rated speed, so it would not be economically viable.
|
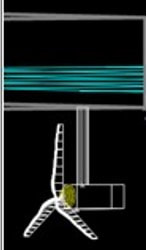
Figure 4: Current turbine design side view
|
Therefore, we chose to incorporate 4 current turbines of 5 kW nominal power capacity each. The turbines are axial flow ones with a 5m rotor diameter, which is suitable for our case since the river current flow is unidirectional and thus, the cross-flow turbines would lose their advantage. The turbines are suspended underneath the platform base through a cylindrical shaft which is connected to their rotor and blades through their nacelle. The distance to each other was chosen to be 18m (more than 3 times their rotor diameter). This was done because, as [7] suggests, there has to be enough space in order to ensure that the turbulence created by the rotation of the front turbines’ blades will have a minimal effect on the water flow and hence, the rear turbines’ generation will remain unaffected. Moreover, a bottom clearance of 4 to 5 meters (depending on the water elevation levels) is considered, so that any impact on the riverbed sediments will be avoided.
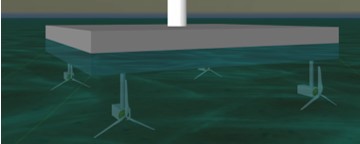
Figure 5: Current turbine design front view
The advantage in this idea is that these turbines could operate more effectively in lower stream velocities than a bigger one, plus they are considerably less costly.
Energy output
The average power output of each river current turbine is estimated through the following equation:
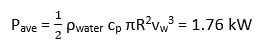
where ρwater= 1000 kg/m^3, cp= 0.35, R= 2.5m and vw= 0.8m/s
Consequently, the expected yearly energy output of each current turbine is calculated from the next formula:
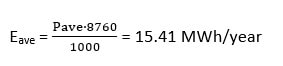
So, the total annual energy production from all the current turbines, as well as their capacity factor, is shown below:
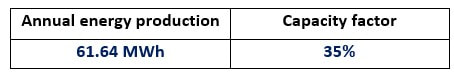
Table 3: Annual energy production and capacity factor for the river current turbines
System energy output
Having calculated the energy generation from both the wind and the river current turbines, we can now conclude that the system’s energy production will be the sum of the two outputs, namely:
Total energy generation: 421.435 MWh/year
This number corresponds to the average annual energy consumption of approximately 130 typical households in Egypt, as the following graph dictates, if we consider that a household consists of two residents in average.
Total energy generation: 421.435 MWh/year
This number corresponds to the average annual energy consumption of approximately 130 typical households in Egypt, as the following graph dictates, if we consider that a household consists of two residents in average.
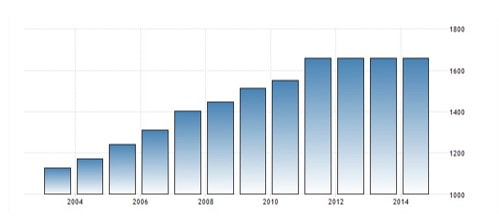
Figure 6: Annual electric power consumption in Egypt (kWh per capita) [8]
References
[1] Cfgreenenergy.com. (2018). [online] Available at: http://www.cfgreenenergy.com/wp-content/uploads/2016/02/CF100-Data-Specifications.pdf [Accessed 9 Feb. 2018].
[2] Windfinder.com. (2018). Windfinder.com - Wind and weather report Balyana. [online] Available at: https://www.windfinder.com/report/qena [Accessed 3 May 2018].
[3] Colmenar-Santos, A., Campíez-Romero, S., Enríquez-Garcia, L. and Pérez-Molina, C. (2014). Simplified Analysis of the Electric Power Losses for On-Shore Wind Farms Considering Weibull Distribution Parameters. Energies, 7(11), pp.6856-6885.
[4] Mortensen, N. G., Said Said, U., & Badger, J. (2006). Wind Atlas for Egypt. In Proceedings of the Third Middle East-North Africa Renewable Energy Conference.
[5] Ahmed, A. (2011). Analysis of electrical power form the wind farm sitting on the Nile River of Aswan, Egypt. Renewable and Sustainable Energy Reviews, 15(3), pp.1637-1645.
[6] Ben Amar, F., Elamouri, M. and Dhifaoui, R. (2013). Transposition of wind measurements to a standard site of open area roughness at a height of 10m above ground level. In: Renewable and Sustainable Energy Conference (IRSEC). IEEE.
[7] Roberts, A., Thomas, B., Sewell, P., Khan, Z., Balmain, S. and Gillman, J. (2016). Current tidal power technologies and their suitability for applications in coastal and marine areas. Journal of Ocean Engineering and Marine Energy, 2(2), pp.227-245.
[8] Tradingeconomics.com. (2018). Electric power consumption (kWh per capita) in Egypt. [online] Available at: https://tradingeconomics.com/egypt/electric-power-consumption-kwh-per-capita-wb-data.html [Accessed 1 May 2018].
|
|
STRATHCLYDE UNIVERITY
16 Richmond Street Glasgow G1 1XQ Scotland, United Kingdom Phone: +44 141 552 4400 https://www.strath.ac.uk © Copyright 2018 |

|