|
|
Load analysis
|
The loads which our system is subject to are of different kinds. The understanding of the way that these loadings operate on the wind and the river current turbines are of paramount importance to avoid their catastrophic failure [1]. Therefore, the most basic types of loads need to be described, whereas the ones with the highest impact on our structure are thoroughly explained and calculated. The aim of this procedure was to ensure that our system can withstand the external forces acting on it without deformation or significant displacement of its equilibrium position and that its dynamic responses to the imposing loads are within the permissible limits, resulting in its safe operation.
|
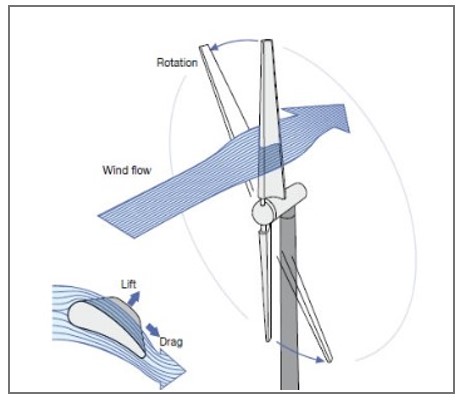
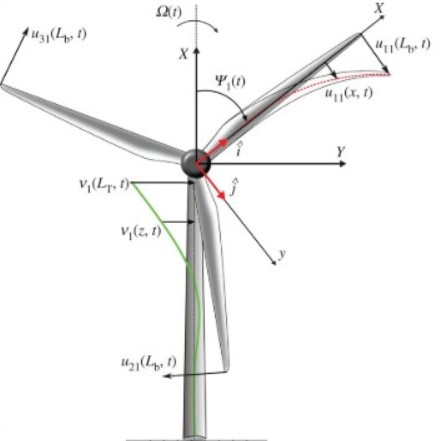
Figure 1. Aerodynamic force on a wind turbine [2]
|
The major elements of loading on our system are the hydrodynamic loads (wave loads and current loads) on the platform and on the current turbines, the aerodynamic loads on the wind turbine’s rotor, the gravitational loads from the wind turbine, the platform and the current turbines, as well as the buoyancy force produced by the volume of displacement of the system in the water [3]. There are, however, more loads that are applied to the components of the structure, such as functional loads from transient operation conditions (braking torque, yawing moment, blade pitching moment) or inertia loads from vibration or gyroscopic effects, but it was not in the scope of this study to involve in these areas [4].
In this work, we decided to neglect the hydrodynamic load from the wave motion, since in this area the waves are usually very small in height and long in period. Consequently, the main interest was set in the aerodynamic load created by the axial thrust force of the wind on the rotor of the wind turbine and the corresponding horizontal force on the current turbines induced by the water stream, which are both calculated below for normal operation conditions, as presented in the figure.
In this work, we decided to neglect the hydrodynamic load from the wave motion, since in this area the waves are usually very small in height and long in period. Consequently, the main interest was set in the aerodynamic load created by the axial thrust force of the wind on the rotor of the wind turbine and the corresponding horizontal force on the current turbines induced by the water stream, which are both calculated below for normal operation conditions, as presented in the figure.
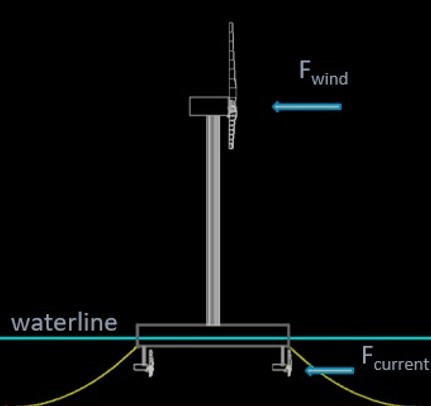
Figure 2. Wind and river current forces acting on the hybrid system
The thrust force of the wind is given through the following equation:

where Fwind is the wind thrust force, CT is the thrust coefficient (which is set to be 2 for normal operation), ρwind = 1.225 kg/m^3 is the air density, Awt = πR^2 is the swept area of the wind turbine blades and Vwind is the wind speed. Considering that the average annual wind speed at hub height on our site is 6.6 m/s^2 and the wind turbine blades’ radius is 12m, we eventually get the above result.
Similarly, the horizontal force of the water current on each current turbine is given through the same equation, in which we replace ρwind with ρwater = 1000 kg/m^3 for fresh water, Act = πR^2 with the radius of each turbine’s blades to be 2.5m, the thrust coefficient is set to be 1.5 for the water and Vcurrent = 0.8 m/s is the average annual water current velocity in this part of the Nile. Therefore: Fcurrent = 9 kN
As it can be noticed, the directions of these forces are antiparallel with respect to the waterline axis. That means that the bending moments they cause in the system are counterbalancing and hence the system achieves dynamic stability. It is safe to assume that this is the usual case, since the wind direction in the chosen location shows that the direction of the wind is mostly stable throughout a year [6].
However, it needs to be proved that the system’s dynamic response will not be seriously affected regardless the wind direction. The dynamic analysis we conducted in Orcaflex software led to the following results in terms of platform’s rotating motions:
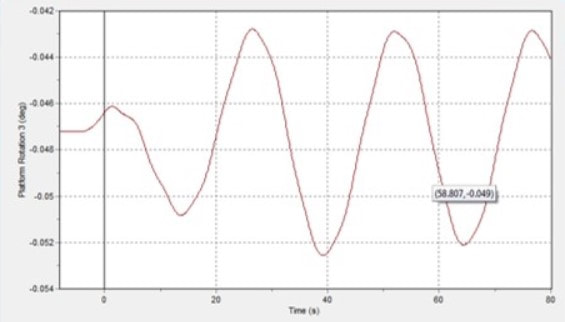
Figure 3: Platform roll rotation
|
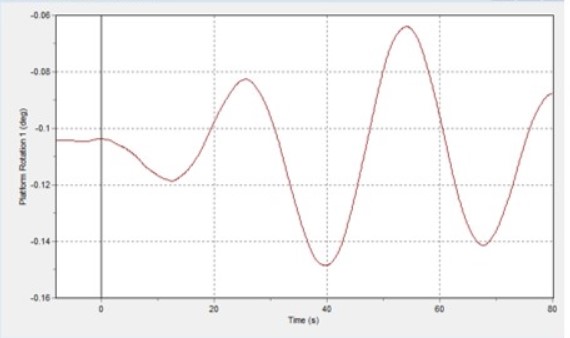
Figure 4: Platform yaw rotation
|
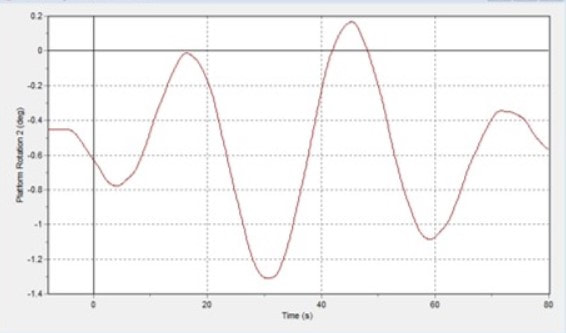
Figure 5: Platform pitch rotation
As it can be directly extracted from the above diagrams, the platform’s rotation is minimal in roll and yaw directions, while in pitch direction it stays in very low levels as well. The result is that in normal operation conditions the system can safely respond to the acting external forces without compromising its dynamic stability.
References
[1] Xu, N. and Ishihara, T. (2014). Prediction of Tower Loading of Floating Offshore Wind Turbine Systems in the Extreme Wind and Wave Conditions. Wind Engineering, 38(5), pp.463-476.
[2] Brands, C. (2018). 101 RENEWABLE - SMALL WIND TURBINES. [online] Cleanenergybrands.com. Available at: http://www.cleanenergybrands.com/shoppingcart/knowledgemanager/questions/157/101+renewable+-+small+wind+turbines [Accessed 3 May 2018].
[3] Liu, X., Lu, C., Li, G., Godbole, A. and Chen, Y. (2017). Tower Load Analysis of Offshore Wind Turbines and the Effects of Aerodynamic Damping. Energy Procedia, 105, pp.373-378.
[4] Gwon, T. (2011). Structural Analyses of Wind Turbine Tower for 3 kW Horizontal-Axis Wind Turbine. MSc in Mechanical Engineering. Faculty of California Polytechnic State University.
[5] Tezdogan, T. (2018). Marine Renewable Energy Systems (NM522/NM969), Lecture Notes. Department of Naval Architecture, Ocean and Marine Engineering, University of Strathclyde.
[6] Windfinder.com. (2018). Windfinder.com - Wind and weather report Balyana. [online] Available at: https://www.windfinder.com/report/qena [Accessed 3 May 2018].
|
|
STRATHCLYDE UNIVERITY
16 Richmond Street Glasgow G1 1XQ Scotland, United Kingdom Phone: +44 141 552 4400 https://www.strath.ac.uk © Copyright 2018 |

|