|

|
Introduction
After the technical analysis has been done, we continued to carry out the financial analysis. This was done in order to break down the project cost and to determine the amount of money the consumers need to pay for electricity. Since our aim is to investigate the feasibility of the project, it also needs to be economically beneficial. In this section, the financial analysis was concentrated on three main tasks:
- Levelized Cost of Energy
- Payback Period
- Sensitivity Analysis
What is LCOE?
Levelized Cost of Energy (LCOE) is the minimum cost to generate electricity, also known as the estimated energy production cost, in which the energy must be sold to make the project profitable. In order to calculate LCOE, the initial capital, operation and maintenance costs and other costs of transmission lines and substation for any power generation need to be considered. The LCOE can be expressed in £/MWh or p/kWh. The equation used to calculate the LCOE [1] has been expressed as follows:

where:
- Ct= Total Initial Capital or Investment expenditure of the project in year t
- Mt= Operation and maintenance expenditure in year t
- Qt= Annual Energy Generation in year t
- r= Discount rate
- T= Life cycle of the project
Initial Capital Cost (CAPEX) and Operation & Maintenance Cost (OPEX)
Since the nominal wind power output is 100kW, the capital cost of the wind turbine has been taken from the statistics based on the current price of the commercial small scale wind turbines [2]. The annual OPEX was considered in two categories [2] [3] which is 1.5% of CAPEX for first half of life cycle and 2% of those for latter half of the period. The capital and O&M cost of wind turbine can be seen in Table 1. As the horizontal type current turbine is not much commercial at the moment, the CAPEX and OPEX of current turbines has been made as an assumption from the prices mentioned in article [2]. The description of the current turbines costs can be found in the table 1 as well.
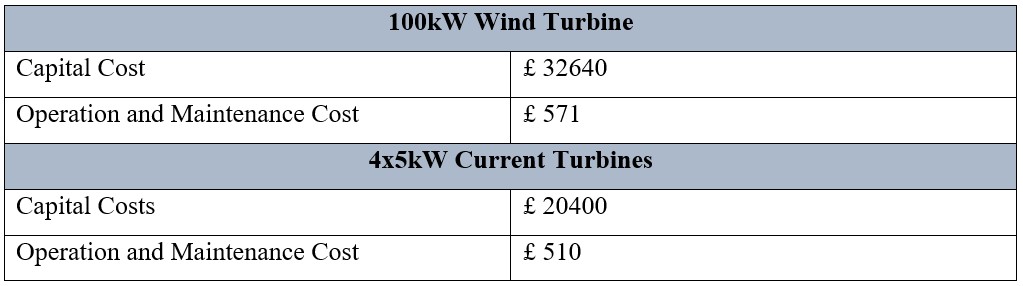
Table 1: CAPEX and OPEX of wind and current turbines
The capital cost of the platform has been calculated by using analytical weight cost relation method considering the index of 2017 EU and World Steel price [4]. The capital cost of the platform was estimated to be £12,500 including the building cost and the substation cost was assumed to be £8,500 covering with the costs of transmission and mooring lines.
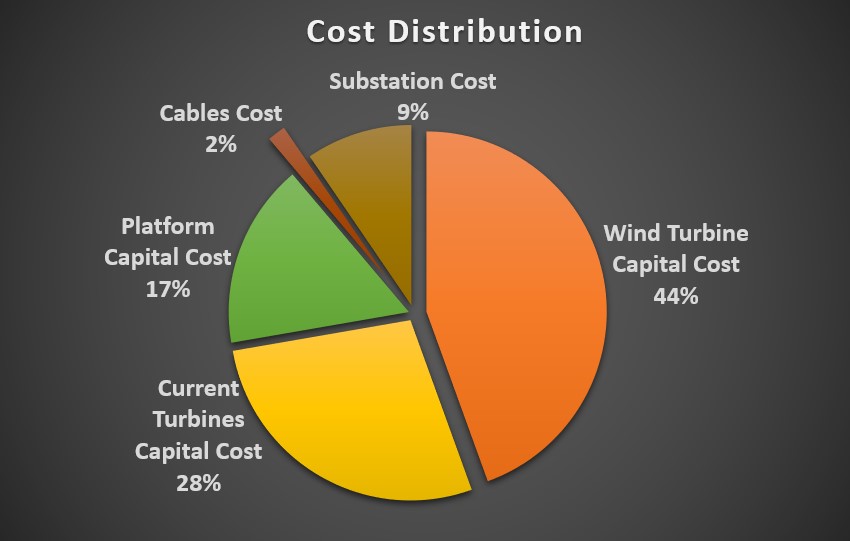
Figure 1: Cost Distribution Chart of the system
At this point, the project was considered to have 20 years of life time which is the typical life cycle for the wind turbine. Then the LCOE was calculated and the result is shown below:
LCOE = 0.14 p/kWh
LCOE = 0.14 p/kWh
Payback period
The payback period of the project was estimated as well. The detailed calculation procedures can be found in the Financial Analysis Excel spreadsheet and the result of the calculation can be seen in the following figure. If the annual electricity is produced properly, we expect that a profit could be made within 11 years of project life.
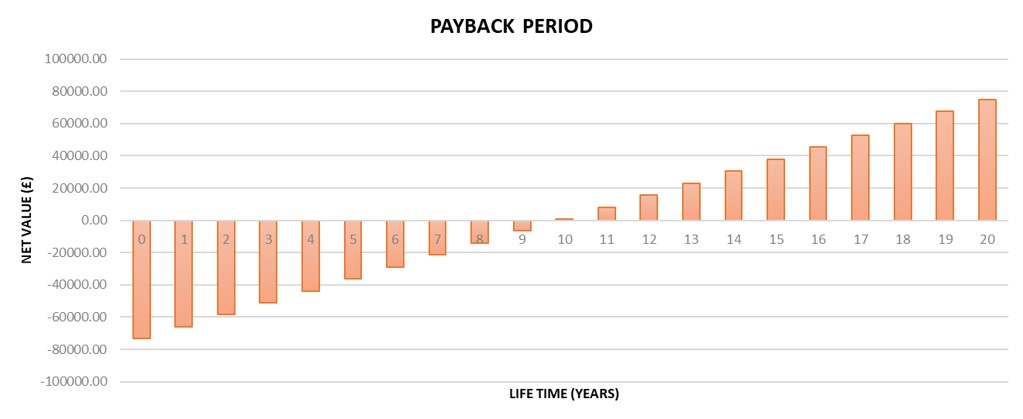
Figure 2: Payback period of our system
Sensitivity analysis
Besides the idea to perform uncertainty, the sensitivity analysis for LCOE was investigated for the project. The calculation was assumed by changing the capacity factor of both wind and current turbines. Since our project is proposed to be deployed in the river, in some point the energy could not be produced properly in the downtime weather condition affecting power generation. This may result in the rise of LCOE. The results have been summarized as follows:
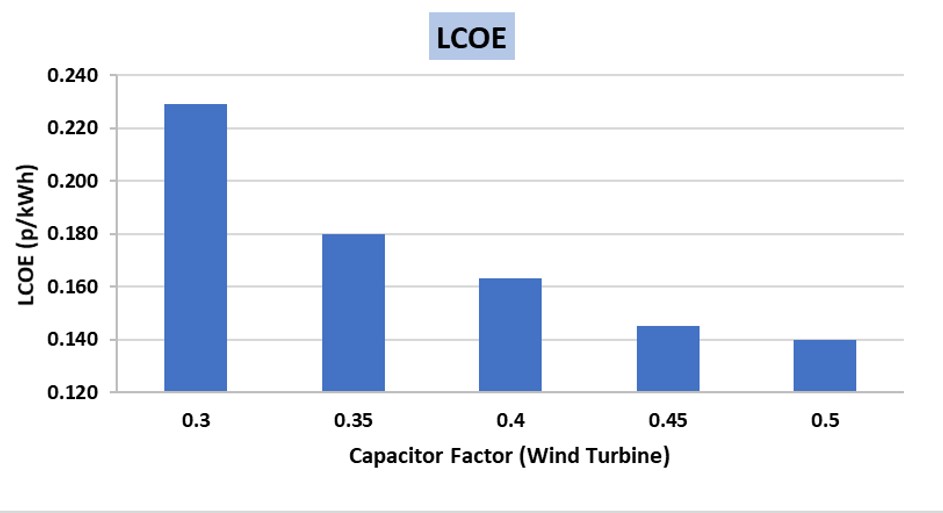
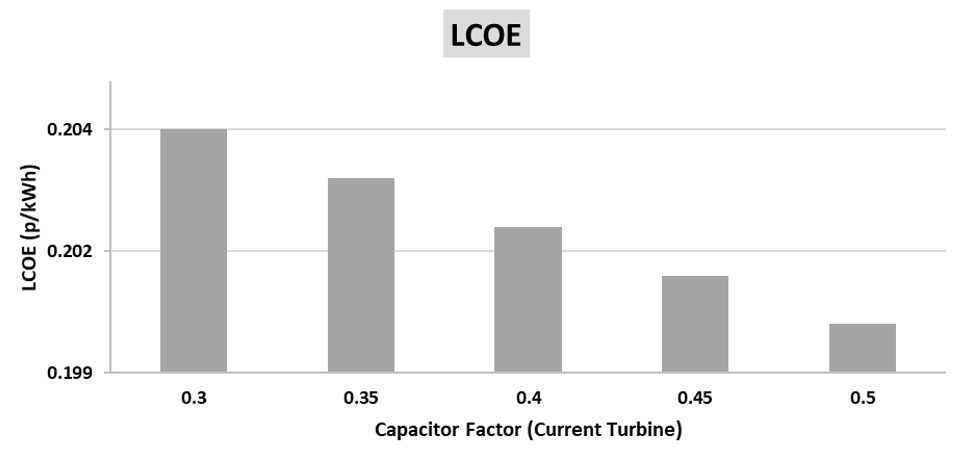
The following figure (5) gives a better understanding of how the capacitor factor affects the power output of the turbines:
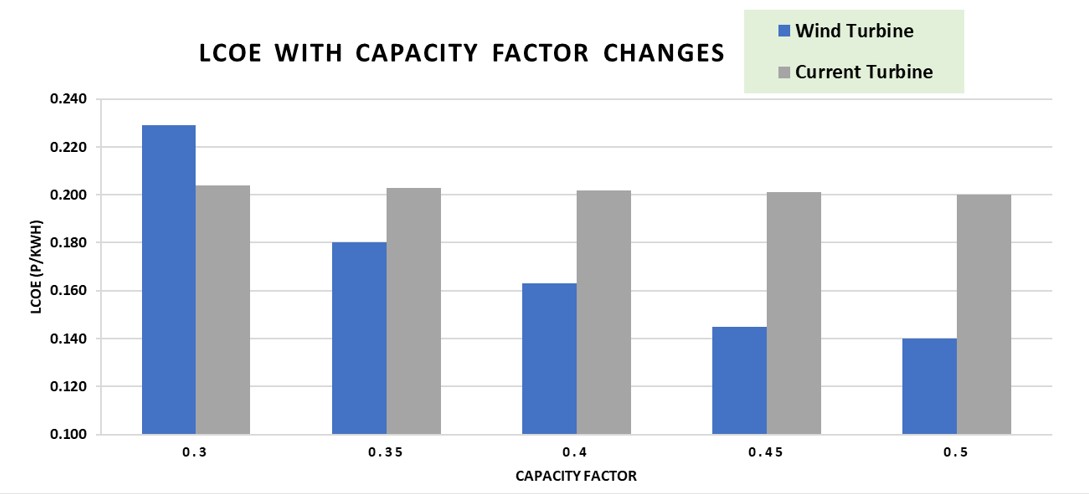
Figure 5: Comparison of LCOE with Capacitor Factor Changes
Conclusions
The conclusions can be summarized into two different views based on the estimated results and the future expectation. First of all, the LCOE of 14 p/kWh is moderate for the energy production, therefore we expect the strike price to be 16 p/kWh. In order to make an effectively profitable project, the strike price should be higher than the LCOE. But the expected value is slightly expensive for the local Egyptian households [5]. Therefore, we investigated another option to reduce the cost. Since the Egyptian Government targeted that by 2010 20% of National Energy Production will come from the Renewable Energy Sector [6] [7], it is safe to believe that governmental subsidies would be available in order to reduce the project cost. Lastly, we have done the Sensitivity Analysis only for the capacity factor changes which we considered as the major influence parameter. However, there are other paramaters which affect LCOE, such as, the running costs but it was not in the scope of this work to investigate how they could be reduced. Consequently we considered them stable along the years. After all, it is concluded that with the appropriate governmental support our project would be economically viable with a normal payback period.

The excel file which was used for the calculations can be downloaded
References
[1] Keeley, A. (2016). The Importance of Financial Cost for Renewable Energy Projects - LCOE Analysis of a Case in Indonesia. SSRN Electronic Journal.
[2] Eshra, N. M. & Abdelnaby, M. E., (2014). Study of Application of Small Hydropower for Nile River in Egypt. Middle East Journal of Applied Sciences, 4(4), pp. 1118-1129.
[3] Hou, P., Enevoldsen, P., Hu, W., Chen, C. and Chen, Z. (2017). Offshore wind farm repowering optimization. Applied Energy, 208, pp.834-844.
[4] Quandl.com. (2018). Quandl. [online] Available at: https://www.quandl.com/collections/markets/industrial-metals [Accessed 8 May 2018].
[5] Yousri, D. M., (2011). The Egyptian Electricity Market: Designing a Prudent Peak Load Pricing Model. German University in Cairo, Faculty of Management Technology.
[6] Export.gov. (2018). Egypt - Renewable Energy | export.gov. [online] Available at: https://www.export.gov/article?id=Egypt-Renewable-Energy [Accessed 4 May 2018].
[7] Enterprise. (2018). Electricity Ministry ups target for renewable energy development | Enterprise. [online] Available at: https://enterprise.press/stories/2017/12/19/electricity-ministry-ups-target-for-renewable-energy-development/ [Accessed 8 May 2018].
|
|
STRATHCLYDE UNIVERITY
16 Richmond Street Glasgow G1 1XQ Scotland, United Kingdom Phone: +44 141 552 4400 https://www.strath.ac.uk © Copyright 2018 |

|