Results
This page will present the results obtained from the simulations of the 2050 UK grid scenarios modelled using the EnergyPLAN software. The scenarios modelled are explained in the 2050 Scenarios section of this website.
This section will assess the following data in order to analyse the performance of each grid and allow comparisons of performance to be made:
This section will assess the following data in order to analyse the performance of each grid and allow comparisons of performance to be made:
- 2050 Scenarios Supply Mix Assessment
- Electricity grid CO2 emissions;
- Total electricity generated from conventional thermal power stations;
- Assessment on grid balancing by foreign import and export;
- Impact of introducing wind lulls on a renewable energy grid.
2050 Scenarios Supply Mix Assessment
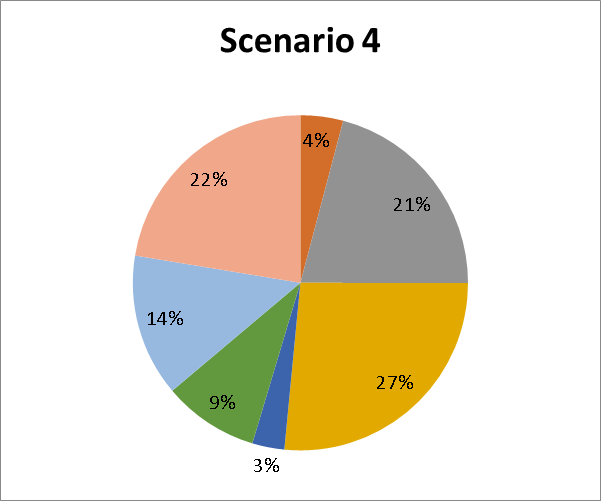
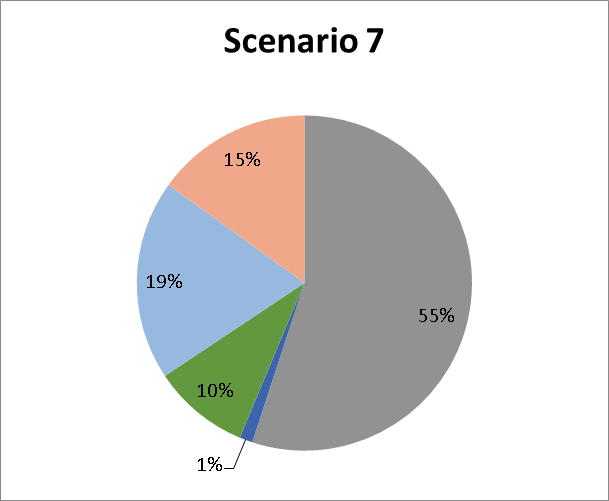
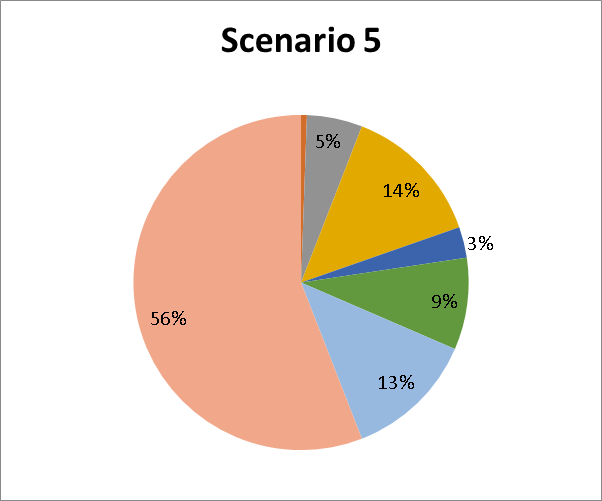
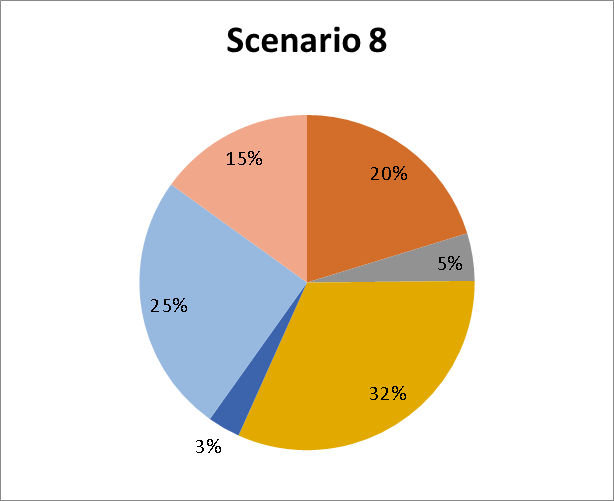
Figure 1 to below shows the supply mix for each scenario. The charts provide a breakdown of the contributions of each sector to the UK electricity grid in order to supply the 400TWh demand. Table 1 provides a short description of the scenario. For a more detailed description of the scenario, see the 2050 Scenarios tab.
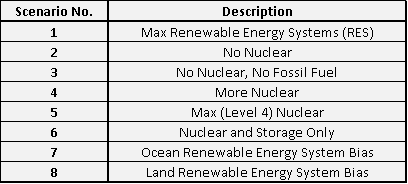
Table 1: Scenario number and descriptions
|
|
|
|
|

|
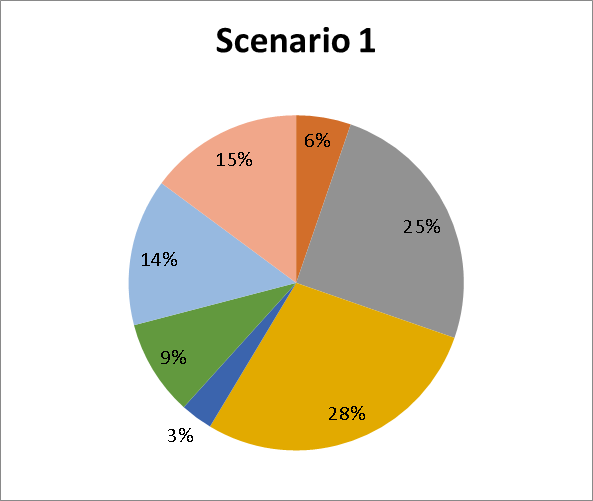
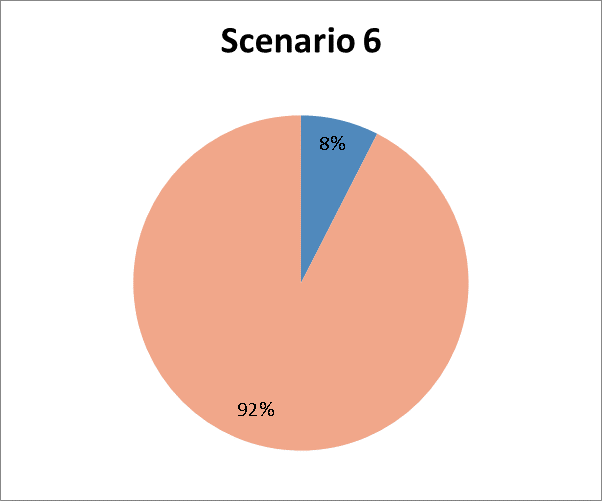
Figure 1: Scenario Supply Mixes
Scenario 1 has maximum installed renewable energy systems (RES) however there was still a reliance on nuclear and conventional power generation. As a result, wind contributed a total of 53% of the supply, but nuclear and conventional power plants contributed 29%, which is still significant and demonstrates the reliance of the despatchable conventional power stations. Also of significance is the zero need of import as the grid is able to rely on it's own despatchable generators. Despite having a large installed PV capacity, the subsequent contribution to the grid from PV was only 6% of the total supply.
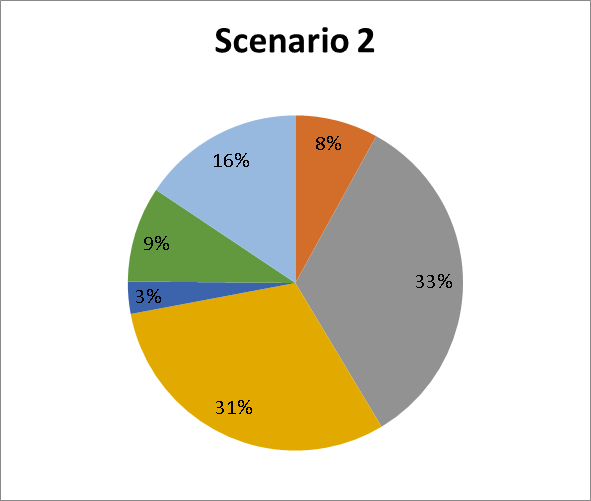
Scenario 2 removed nuclear power from the mix and the difference was predominately made up from increased supply from wind (now 64%), slight increase in conventional and PV. It should be noted that this is not due to the fact that wind and PV are where generating more, instead as figure 2 below shows there is less export required to get rid of the surplus electricity generated.
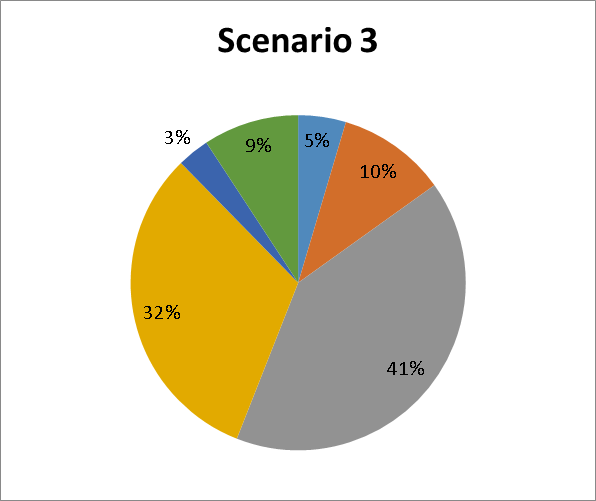
Scenario 3 removed conventional power and nuclear. Removing the dependency these plants put a significant strain on the grid as it required 5% import from Europe to make up for any deficit and aid with grid balancing. Also, figure 2 below shows export also decreased and supply from wind increased over the previous scenario to 73%.
Scenario 2 removed nuclear power from the mix and the difference was predominately made up from increased supply from wind (now 64%), slight increase in conventional and PV. It should be noted that this is not due to the fact that wind and PV are where generating more, instead as figure 2 below shows there is less export required to get rid of the surplus electricity generated.
Scenario 3 removed conventional power and nuclear. Removing the dependency these plants put a significant strain on the grid as it required 5% import from Europe to make up for any deficit and aid with grid balancing. Also, figure 2 below shows export also decreased and supply from wind increased over the previous scenario to 73%.
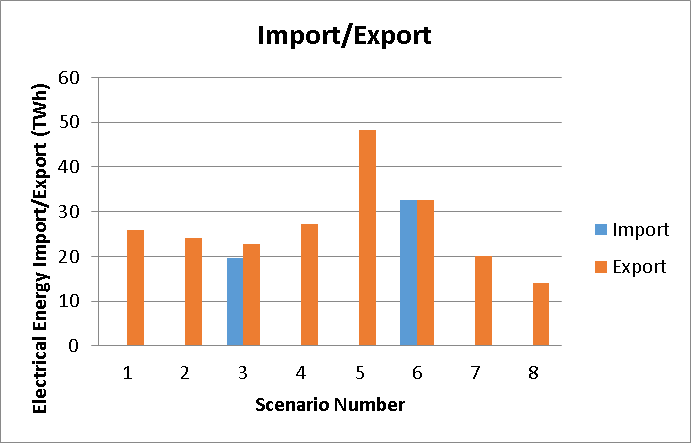
Figure 2: Scenario Imports/Exports
Scenario 4 increased the nuclear power installed capacity in the UK electricity grid, and conventional power remained the same as scenario 1 and 2. The consequences of this is that there is once again no reliance on import, and there is now less intake from wind and PV. Instead, as figure 2 shows, the export increases in order to aid with grid balancing and dealing with surplus generation.
Scenario 5 further increased the installed capacity of nuclear power, the consequences of this is the increased proportion of nuclear supply (now 56%), and reduced the dependency on the other power systems. but reducing the offtake from non despatchable sources such as wind and solar meant that the grid had to increase it's export to approximately 48 TWh which is an 77% increase from scenario 4. However, this scenario had no reliance on European import.
Scenario 6 is only powered by nuclear and balanced with pumped storage, however it is clear from the chart that the storage capacity is not sufficient to balance the grid this is because the grid is still reliant on import which made up 8% of the total supply. This is the highest import level of the eight scenarios. The contribution from nuclear power to this grid is 92%.
Scenario 7 increases the reliance of ocean based renewable energy systems such as tidal and off shore wind as the installed capacity of land based renewable energy systems such as PV and onshore wind has been removed. This was done in order to attempt to minimize the land use (land use values are available in feasibility section of the website). The consequences of making the grid more ocean biased was the significant increase of the supply from offshore wind (55%). It should also be noted that this scenario had the second lowest export of 20TWh and there was no reliance on import (see figure 2).
Scenario 8 increases the reliance of land based renewable energy systems such as onshore wind and PV as the installed capacity of ocean based renewable energy systems such as offshore wind and tidal have been reduced. The consequence of this is that the contribution from conventional power generation is now at 25% which is the highest of the eight scenarios. The increased dependency on conventional power stations has caused scenario 8 to have the highest CO2 emissions of 49Mt. It should also be noted that the other consequences on the increased reliance on conventional power is that Scenario 8 has the lowest export of only 14TWh (see figure 2).
CO2 Emissions
The CO2 emissions associated with the electricity grid in 2014 was 133 Mt, so in comparison with present day emissions, all eight scenarios have shown a significant reduction in CO2 emissions. It should be noted that the CO2 values were generated by EnergyPLAN and take into account embedded CO2 emissions associated with factors such as construction, transportation and sourcing fuel.
Figure 3 presents the CO2 emissions from the 2050 scenario simulations. It is clear that scenario 3 and 6 (see table 1) have the lowest CO2 emissions each only have emissions of 0.7Mt for the full year. these were the scenarios that had no conventional power plant installed capacity however they did rely on import as shown in figure 2 above.
The scenarios with the highest CO2 emissions was number 8 with 49Mt which was the result of increased dependency on conventional power stations. This scenario also had the lowest export which shows the benefit of having despatchable energy source in the grid in balancing supply with demand.

Figure 3: Scenario CO2 emissions
Conventional Power Generation
An interesting output to assess is the level of reliance on fossil fuel. With such high capacities of renewable energy available, we would like to see to what degree this reliance comes down from 2014 levels. For reference, in 2014 the power output from conventional sources was around 190TWh.
Figure 4 below shows that scenarios 3 (No Nuclear, No Fossil Fuel) and 6 (Nuclear and Storage Only) have no reliance at all. This goes without saying, as there is no conventional power available in the first place for EnergyPLAN to make use of. Amongst the other remaining scenarios, there are a variety of values in the range of around 55-105TWh of produced power. Scenario 5 (Level 4 Nuclear) has the lowest output, and scenario 8 (Onshore RES Bias) has the highest.
Although these scenarios are still utilising conventional power, these are considerably lower values than 2014. Especially if we bear in mind that there is a substantial increase in demand to accommodate.

Figure 4: Scenario Conventional Power Outputs
Impact of Wind Lulls on Renewable Energy Grids
On evaluation of the results of the alternative scenarios which incorporated periods of no wind, it showed that the supply mixes were still capable of meeting the demand, however this comes at a cost. As was expected, the CO2 emissions increase for these in comparison with their original scenario results. See figure 5 below. this is due to the increased reliance from conventional power when the wind farms are not able to produce power.
It is important to note here, that we simulated 4 separate 2 week periods of no wind throughout the year so as to make a very conservative assessment. This is unlikely ever to happen in reality, so the effect on CO2 emissions would not be as extreme as is shown here.
Having said that, the increase still sees the worst case alternative scenario with an emissions level of less than 60Mt. To compare this with the 2014 level of around 130Mt, it is clear that the overall results are still positive.

Figure 5: Alternative Scenario CO2 Comparison