8 initial scenarios were created, which are described below. There are some factors which are common across all scenarios such as:
- Wave power is never considered; we assume zero capacity for wave power due to the fact that it is a very early stage technology, with no clear route forward for use in the main stream. Therefore it is categorised as a ‘concept’ technology on this project.
- Only tidal barrage is considered, we have not added any capacity for tidal stream for the same reason as above.
- It is assumed that by 2050, all coal fired power plants will have been phased out. So in scenarios where fossil fuelled power output is assumed to be ‘the same as 2014 levels’, we have kept the overall plant output the same, but shifted the share from coal over to gas. The government have a target to phase out all coal power by 2025 (Gov.uk, 2015), so we are assuming that this will have been met by 2050.
- ‘Power plant’ in EnergyPLAN is made up of coal, natural gas, biomass and oil. A a total capacity is defined for them all together, and the share from each is defined separately which tells the software how much each contributes.
- In each case, the capacity of storage has been increased by 200GWh (i.e. 2050 total = 226.7GWh) as this is the recommended increase which could be made as per the study carried out by Tom Hoy (Hoy, 2015). We are assuming that this will be made up of pumped hydro as it is the most likely technology to be used to supply such a high level of storage capacity, however within EnergyPLAN it does not differentiate between storage technologies. For example, a small percentage of this total could be from compressed air energy storage or batteries but it would still be modelled in the same way.
- We have not made any changes to biomass supply as we do not consider it to be a sustainable solution within the UK (as on a large scale it would need to be imported) which therefore causes complications in terms of calculating CO2 emissions. For this reason, biomass capacities do not change.
With this in mind, the scenario descriptions are as follows:
Scenario 1: Maximum Renewable Energy Systems (RES)
This scenario considers level 4 capacities for all renewable energy systems. The capacities for power plant and nuclear are as per 2014 levels.
Scenario 2: No Nuclear
Here, level 4 capacities are again used for all renewable energy systems and the power plant capacities are as per 2014 levels. However this scenario sees the complete phasing out of nuclear power.
Scenario 3: No Nuclear, No Fossil Fuel
This scenario is as per scenario 2 only this time power plant is phased out. i.e. all energy comes from level 4 renewable energy systems and storage.
Scenario 4: More Nuclear
Scenario 4 uses level 4 renewable energy systems, power plant as per 2014 levels, but nuclear power capacity is increased to 1.5 x 2014 levels.
Scenario 5: Max (Level 4) nuclear
This scenario is as per scenario 4 but the nuclear capacity is increased right up to level 4.
Scenario 6: Nuclear and Storage Only
Here, all forms of supply are reduced to zero apart from nuclear and storage. The nuclear capacity is ramped right up to all the total output to meet the yearly estimated demand of 400TWh which goes above the level 4 value. This works alongside storage to help match supply and demand during fluctuations. The storage capacity is again 206.7GWh, however in this case the turbine/pump capacity is also doubled compared with the other scenarios.
Scenario 7: Ocean Renewable Energy Systems Bias
This scenario is similar to scenario 1, however any onshore renewable energy technologies have capacities in line with level 1 values.
Scenario 8: Land Renewable Energy Systems Bias
This scenario is similar to scenario 1, however any offshore renewable energy technologies have capacities in line with level 1 values.
We then also created an alternative scenario for each one which includes wind power in the mix (all apart from scenario 6: Nuclear and Storage Only). The reason for this is that we are aware of the possibility for anticyclones to cause extended periods of low wind speeds and we wanted to cover this possibility in our analysis. So we manipulated the wind distribution data file to simulate two week periods of no wind throughout the year and this file was used to run these alternative scenarios.
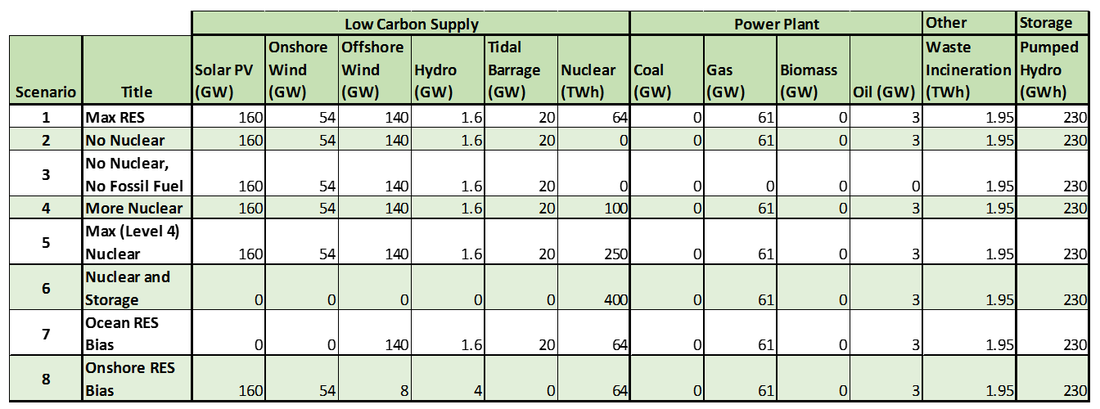
Table 1: Summary of Scenario Supply Capacities
References:
Gov.uk 2015, New direction for UK Energy Policy.
Hoy 2015, The Role of Additional Pumped Hydro Storage in a Low Carbon UK, Grid,
Gov.uk 2015, New direction for UK Energy Policy.
Hoy 2015, The Role of Additional Pumped Hydro Storage in a Low Carbon UK, Grid,