Following the selection of the EnergyPLAN Software , it is necessary to take modelling software through a verification process prior to using it for modelling 2050 electricity grid scenarios. The reasons for the verification is to:
This page describes the verification method, data gathering process, any difficulties encountered and the outcome of the verification process in order to confirm the confidence to use EnergyPLAN for modelling 2050 scenarios.
- Gain confidence in the EnergyPLAN software;
- Gain confidence in using the software correctly;
- Understand any difficulties within the software and know how to work around them;
- Extra training.
This page describes the verification method, data gathering process, any difficulties encountered and the outcome of the verification process in order to confirm the confidence to use EnergyPLAN for modelling 2050 scenarios.
Verification Method
|
The approach to verifying the EnergyPLAN software is to construct a model of the 2014 UK electricity using data regarding electricity demand and supply which is available from Digest of UK Energy Statistics (chapter 5 and 6 ) (DECC, 2015) publications and Gridwatch-Templar website (Gridwatch, 2016). Information required for the model is indicated by the schematic (see Figure 1)
Electricity generation system capacities and distribution profiles are entered into EnergyPLAN as well as the UK electricity demand to be met for a balanced grid. The distribution profile for the renewable energy systems (in particular wind and photovoltaic) is significantly influenced by the climate conditions for 2014. Hourly distributions is a varying percentage scale determining the portion of the installed capacity of the plant supplying the grid. |
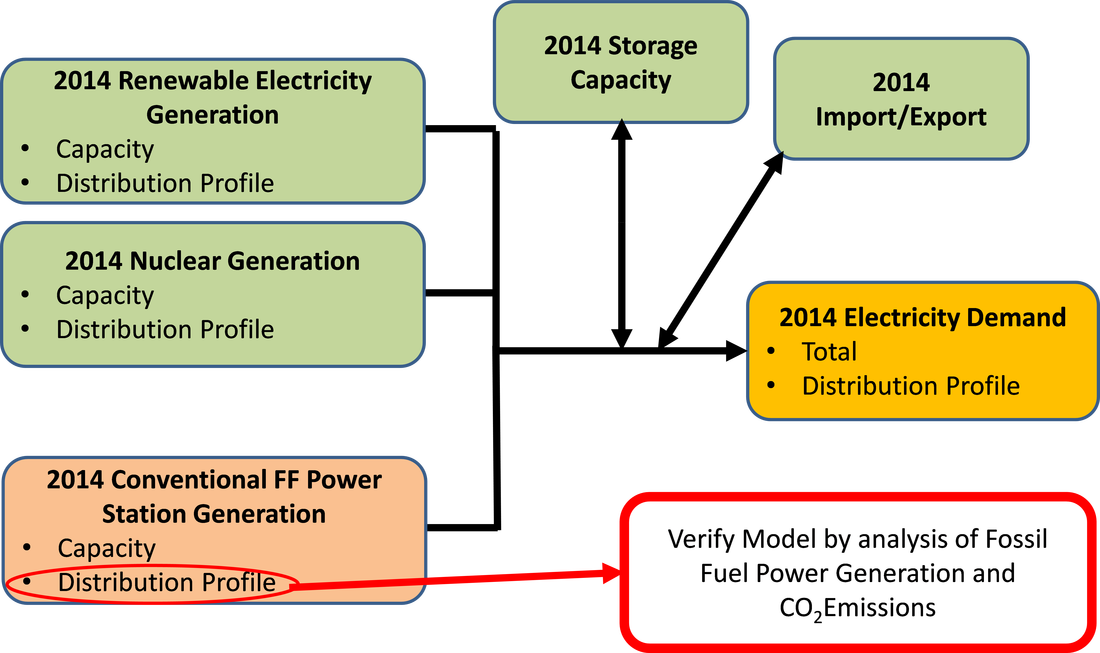
Figure 1: Simplified EnergyPLAN Model Schematic
|

Following the set up of 2014 UK Electricity Grid Model on EnergyPLAN, verification was carried out by comparing the following between the information generated by the EnergyPLAN simulation and the historical data provided by DUKES, and Gridwatch:
- 2014 CO2 emission associated with electricity generation (Mt);
- Thermal and renewable power plant electrical power output profile over the year (MW);
- Thermal and renewable power plant energy output comparison for the full year (TWh).
Data Gathering for EnergyPlan
As mentioned above, 2014 demand data and renewable energy generation data can be gathered from Gridwatch. In general the model requires installed capacities of the various electricity generation plants as well as a there their hourly power distribution throughout the year. The power output is determined by a scaled distribution profile. These profiles are available from Gridwatch data sets.
The logging rate of the data recorded on Gridwatch is every 5 minutes. Therefore, over the full year there are over 100,000 data points. EnergyPLAN uses data sets that have a data point every 1 hour. Therefore, when applying the model to the full year, the total number of data points in a set is only 8784 (Lund, 2015). Because of this difference it is not possible just to simple download the data set from Gridwatch and place it directly into EnergyPLAN. The Gridwatch Data needs to be compressed down to 8784 rows in order to be accepted by the EnergyPLAN Software.
In order to ‘compress’ the Gridwatch for EnergyPLAN compatibility, it was necessary to place the data into excel, then using an excel function, group up 12 sets of the the 5 minute data points and sum them, then finding the average of this to get the hourly average. Thus providing 8784 hourly data points which is then compatible with energy plan (Lund, 2015).
|
2014 Electricity Grid
Using the data sources mentioned above the capacity of supply systems of the UK grid (as it was in 2014) where entered into the EnergyPLAN verification model. the Installed capacities are shown in Figure 3. Table 1 shows the installed capacity values as well as the source for the installed capacity and the hourly distribution profile used in the model. Click on Figure 3 in order to access more detail of the 2014 UK electricity grid composition. |
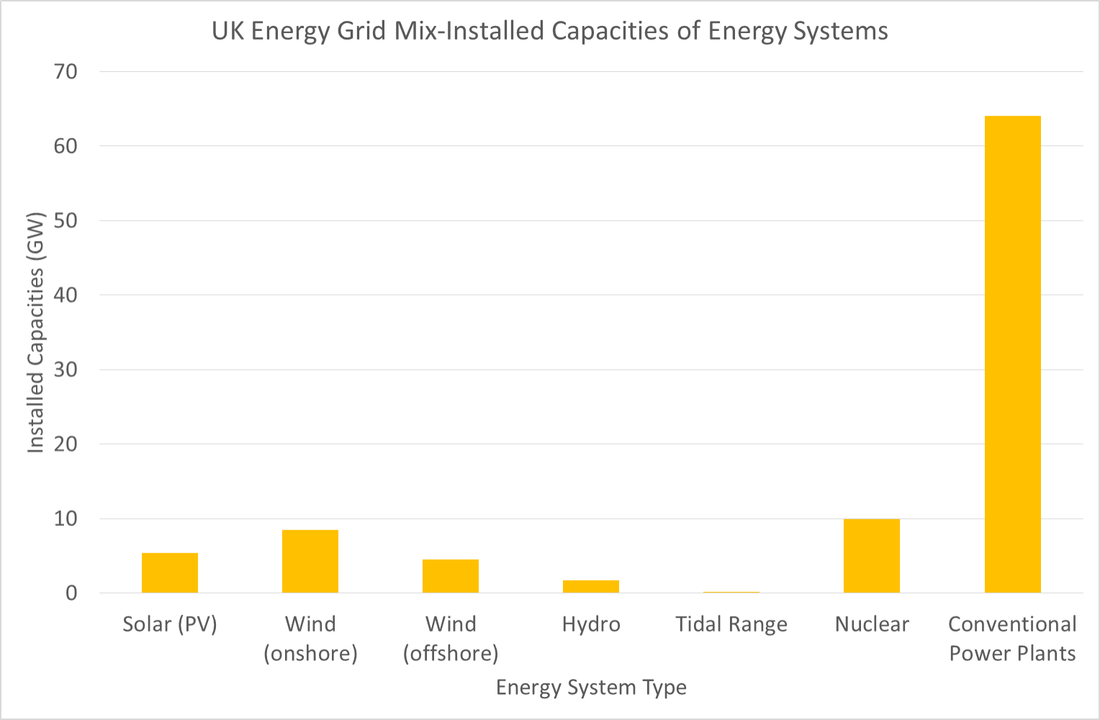
Figure 3 2014 UK electricity grid supply systems installed capacities. Data source from DUKES chapter 5 and 6 (DECC,2015)
|
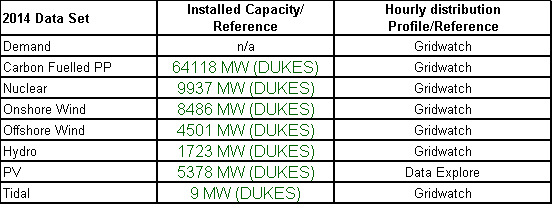
Table 1 Installed capacities with data sources and hourly distribution profile sources
Verification Results and Outcome

Table 2: Summary of the total electrical output from a variation of sources
|
Table 2 shows a summary of the EnergyPLAN 2014 Grid Model and historical data and Figure 4 below also shows a comparison. The table and bar chart allows a comparison between the model data and the historical data.
Firstly, the main focus is to compare the total electrical energy generated from conventional power plants. EnergyPLAN calculated 196TWh following the simulation run, this is within 3% of the historical value. A close match was also achieved between the EnergyPLAN CO2 emission (127Mt) and the CO2 emission according to DUKES (134Mt) with a difference of 5%. |
Further assessment is made of the different energy sources (see Table 2 and Figure 4 below ). There appears to be a good match throughout for the larger scale systems (such as nuclear, onshore wind and offshore wind). However, the historical data is typically less than the modelled outputs. As well as modelling errors, the main reason for this is considered to be due to the fact that historical date rellys on souring information from mettered recordings from mettered devices. Not all electricity generators are metered such as portable or domestically installed devices.
PV and Hydro hass shown large differences, this large error is again put down to the fact that the historical data doesn;t fully capture unmetered outputs such as domestic roof top PV panels and small scale hydro plants for domestic or small industry use. .
PV and Hydro hass shown large differences, this large error is again put down to the fact that the historical data doesn;t fully capture unmetered outputs such as domestic roof top PV panels and small scale hydro plants for domestic or small industry use. .

Figure 4: Thermal and RES electricity output for the 2014. Comparison between historical data (GW) and EnergyPlan data (EP)
|
Dynamic Data Comaparison The chart in figure 5 shows a typical conventional power plant out put for a winter week during 2014. it would not be practical to show the complete data set for the full year, therefore a week long span of the data was chosen. A winter week is chosen as winter typically when there is the greatest demand on the electricity grid. Although it should be said the assessment was done for the full year, the week selection is for the aid of description on the website. it is clear in Figure 5 that both plots show similar profiles through day and evening and there is a good overlap, however there are some slight mismatches and modelling errors typically at the peaks and troughs, as indicated by the red circles. These aren't considered to be significant enough to reduce confidence in using the software for grid modelling. |

Figure 5: Carbon fueled generator (fossil fuel and biomass) output for a typical winter week. Comparison between historical data (Gridwatch, 2016) and Energyplan data.
|
Review of Renewable Systems Power Output
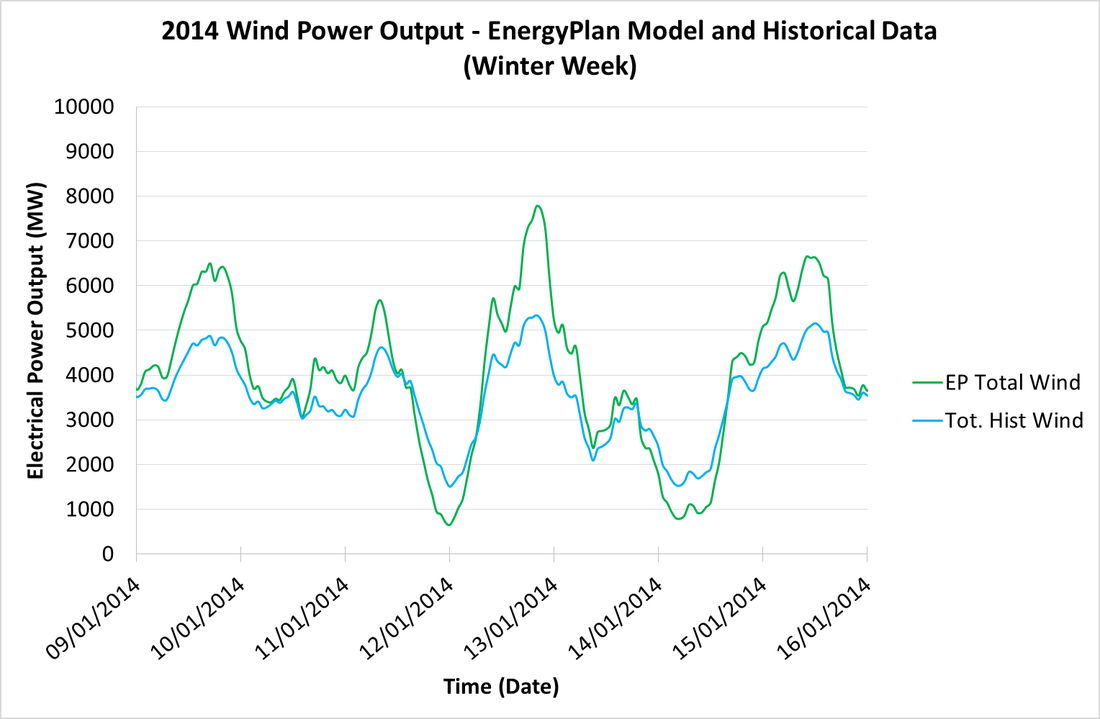
Figure 6: Total wind power throughout a 2014 winter week
|
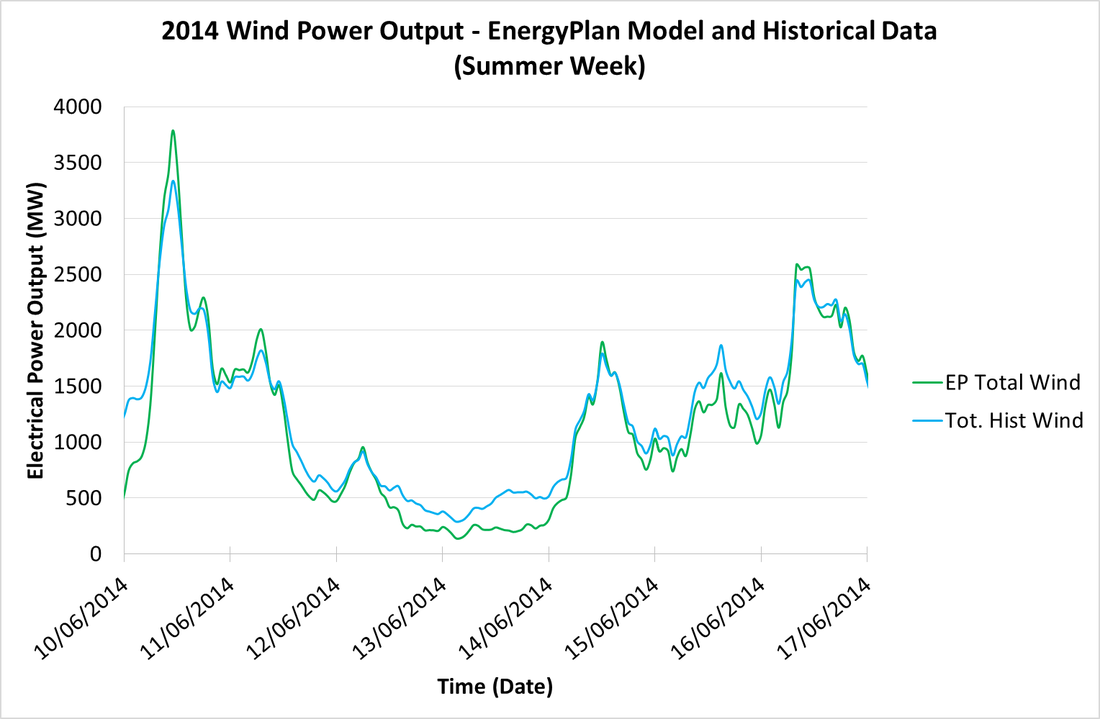
Figure 7: Total wind power throughout a 2014 summer week
|
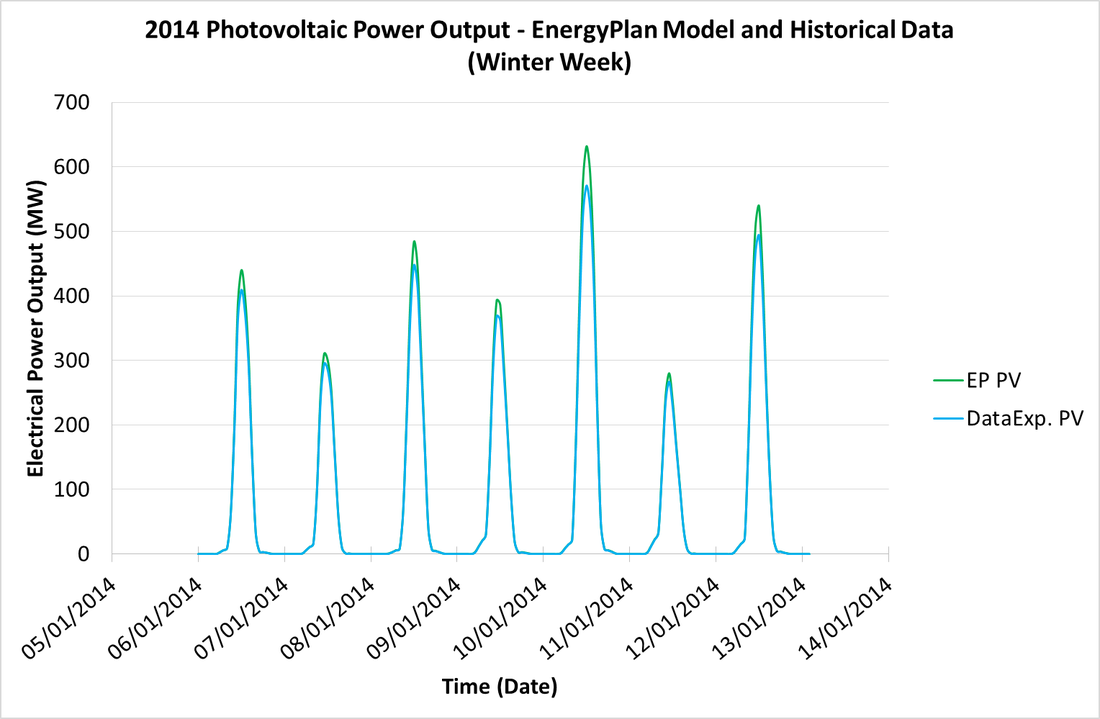
Figure 8: Photovoltaic (PV) power output throughout a winter week
|
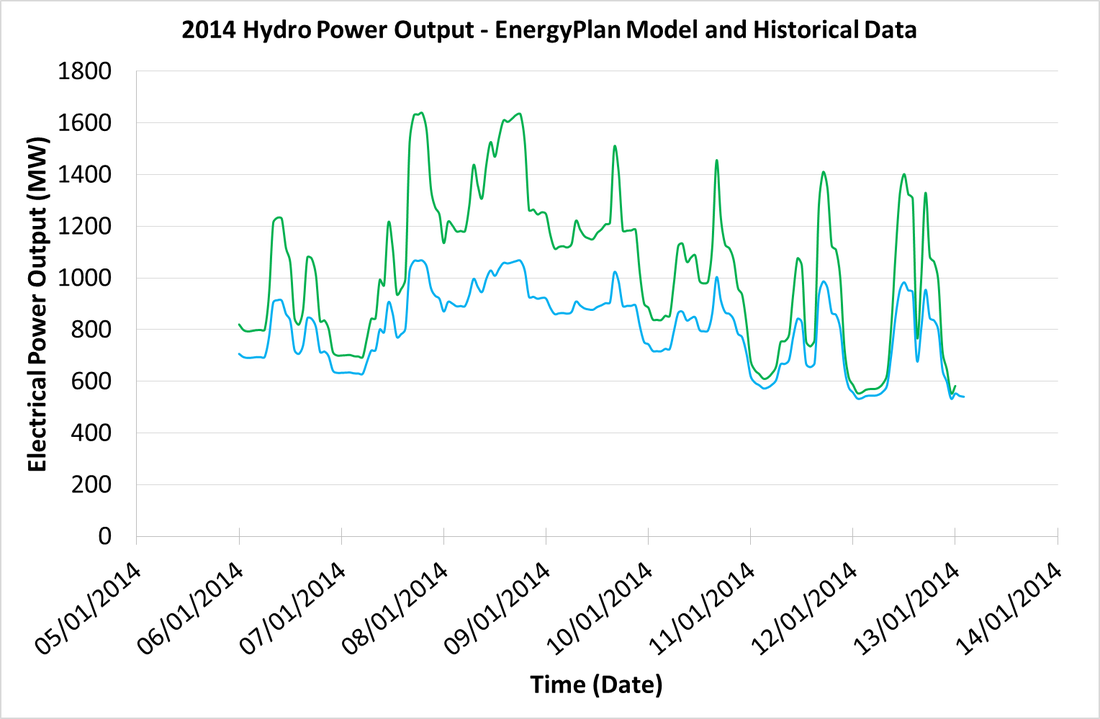
Figure 9: Hydro power output throughout a winter week
|
Figure 6 to Figure 9 above are a selection of data sets for some of the other generation systems in order to view the comparison between historical and modeled data over a week duration. Again, it would be impracticable to show all the data so only a selection is published to give an indication of the different dynamic characteristics of the different generators in the grid, especially those systems dependent on climate input.
All the data sets above again show a good match between historical data and EnergyPLAN modeled data. Any mismatches are considered to be modelling errors and due to inaccuracies in capturing unmetered energy sources such as portable distributed generation systems such as small scale hydro, roof top photovoltaic panels and small wind turbines.
All the data sets above again show a good match between historical data and EnergyPLAN modeled data. Any mismatches are considered to be modelling errors and due to inaccuracies in capturing unmetered energy sources such as portable distributed generation systems such as small scale hydro, roof top photovoltaic panels and small wind turbines.
Conclusion
The 2014 EnergyPLAN verification model fulfilled it's purpose in providing thorough software training and ensuring the development of confidence in using the software, and ensuring the software is being used correctly.
The next stage of the project is to model future low carbon scenarios for the 2050 UK electricity grid.
The next stage of the project is to model future low carbon scenarios for the 2050 UK electricity grid.
References
Department of Energy and Climate Change (DECC), 2015. Electricity: Chapter 5, Digest of United Kingdom Energy Statistics (DUKES).
Department of Energy and Climate Change (DECC), 2015. Renewable sources of energy: Chapter 6, Digest of United Kingdom Energy Statistics (DUKES).
Gridwatch, 2016. GB National Grid Status.
Lund, H., 2015. EnergyPLAN, Advanced Energy Systems Analysis Computer Model.
National Grid, 2016. Data Explorer.