
 Home
Home 
| Tidal
Currents |
Rational
Existing site mapping methods are at currently at polar opposites in regards to bathymetrical accuracy, grid resolution, and usefulness in regards to specific tidal site analysis.
Global bathymetrical maps maintained by the British Oceanographic Data Centre(1) are available in geographic information system (GIS) formats, from a joint collaboration from the international hydrographic office (IHC) and the intergovernmental oceanographic commission (IOC). The General Bathymetrical Charts of the Oceans (GEBCO) was a project to generate the most authoritative publicly available bathymetrical maps. These maps have been the basis for large scale marine tidal and wave modelling but, as their resolution is of grid spacing greater than 1 minute arc with contours typically at 500 metre intervals, their usefulness in specific site analysis is limited.
The US naval Digital Bathymetrical Data Base (DGDB) exists in various versions from private to classified, with its resolution considerably higher than that of GEBCO. Both these data sets were used in conjunction with data from the Proudman Oceanographic Laboratories & Garrad Hassan Ltd. to produce bathymetrical data for the Department of Trade and Industries (DTI) Marine Renewable Energy Resource Atlas (2). A significant leap was made in the resolution of information provided by the 2005 DTI report but warns of errors in sites 1km or closer to shore. This comes in conjunction with further research and recommendations for site-specific tidal analysis.
Multi-beam Sonar with GPS tracking is now increasingly used as an accurate means to map the bathymetry of a specific marine site of interest, this however required considerable investment of time and capital. Consequently for a tidal technology developer this may limit the number of possible sites to be feasibly mapped and analysed.
back to topFigure 1: Prospective Sites 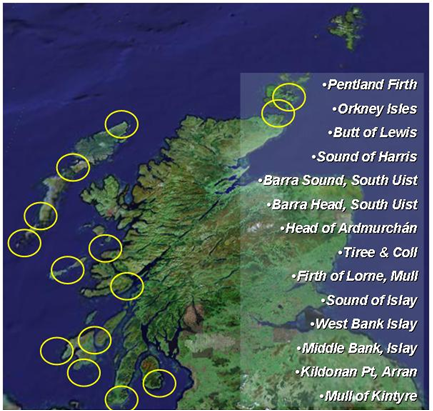
Potential High Energy Sites
In searching for an selecting a high energy site the general selection principles proposed by the DTI 2005 report (3) are as follows;
- Higher currents are only found around certain features, such as channels or constrictions between islands - fast and rectilinear flow
- Headlands in the path of moderate flows - best when the headlands are large and do not protrude too sharply into the flow, otherwise the flows are fast but turbulent, and the high currents may be in different places on ebb and flood
- Estuaries or other resonant water volumes - good sites with rectilinear flow
- Narrow entrances to enclosed tidal lakes - can have very high currents, but only over a small area
The DTI (3) states that,
‘Using these observations, large-scale maps can be used to predict possible sites, but in many places there is insufficient published data to verify whether an actual site is suitable. As marine current exploitation develops, there will be a need for a detailed inventory of potential sites. On small-scale maps, areas that do have high currents appear very small, though in reality each one may be several kilometres long in the direction of flow, and have space for many turbines, potentially generating tens or even hundreds of megawatts. Many suitable areas are several kilometres from the shore, and would be suitable for development as tidal farms, though they would be prohibitively expensive for a single, isolated turbine.’
The above principles can be used to select sites for analysis in addition to utlising the tidal current maps produced by DTI (2)
See Casestudy for further information.
back to top Figure 2: Admiralty Chart Sample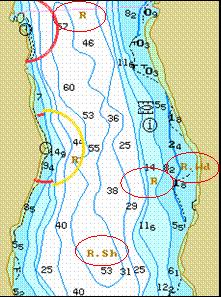
Admiralty Charts
Admiralty charts are the world standard for marine navigational mapping and as such The United Kingdom Hydrographic Office (UKHO)(4) maintain a complete catalogue of maps containing relevant information regards tidal flow, military zones, dumping grounds, shipping routes, fishing areas, pipe lines, telecommunication areas and other areas where marine energy capture (MEC) device deployment would be limited due to these physical and environmental constraints.
Furthermore detailed depth contours and geological information specifying sea bed and channel physical makeup enable us to generate detailed bathymetric profiles including surface roughness for our velocity distribution model. (See Figure 2)
back to top
Methodology
The mapping method outlined below was chosen for our resource analysis in order to generate a velocity distribution for a site. The method consisted of analysing 2D cross-sections of the channel.
In order to generate cross-sections, various methods were tested to automatically vectorise and digitise the available maps so as to extrapolate the required information. This however was found to be time consuming entailing lengthy cleanup with a loss of accuracy. The simplest and most efficient methodology with our available resources is outlined below;
- Once the site to be modelled has been selected, the corresponding map can be imported into an engineering drawing package (AutoCAD) as a raster image.
- Relative measurements on screen and paper are taken to generate a scaling factor to ensure a 1:1 scale, so as to provide accurate measurements of channel depths, sectional area & wetted perimeter.
- The site is then sectioned (See Figure 3) with a relative low offset distance to provide an accurate model of the site bathymetry.
- At each of these sections the depth contours are marked and corresponding depths are coordinated in layers.
- Offsetting each of the layered nodes to their corresponding depth provides a marked array which can then be traced to output 2-D cross sectional profiles.
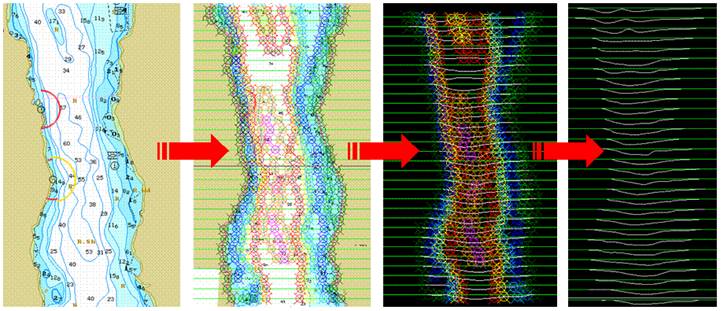
Figure 3: Mapping Methodology
- The profiles are then exported to a graphics software package (Paint Shop Pro) to have the surface roughness of the site geology colour coded along the profile (using MS 16bit colours); each colour corresponding to a particle diameter varying from fine silt to rocks.
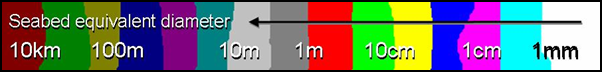
Figure 4: Sea Bed Roughness Legend
- On completion the profile is saved as a 16bit bitmap to be imported into the shear modelling program that was developed over the course of the project to generate a velocity distribution profile.
This simple profiling methodology primarily enables us to accurately input detailed geometrical and geological constraints into our shear and tidal models to calculate bulk flow rates, depth-wise velocity profiles and channel velocity distribution calculations. Previous models used approximated circular, square and triangular sections in open channel flow models.

Figure 5: Channel Colour Coded Profile
Furthermore site models can be generated in adding visualisation
of site bathymetry, site slope & geometry for placement of
MEC devices, and shows depth limitations of deployment.
See Resource Methodology and Casestudy Process for further detail on the mapping method.
References
| 1 | British Oceanographic Data Centre. [Webpage] [cited 02 May 2006]; Available from http://www.bodc.ac.uk/ |
| 2 | GARRAD HASSAN, et al., DTI: UK Atlas of Offshore Renewable Energy. 2004 [cited 02 May 2006]; Government renewable energy policy; Available from http://www.dti.gov.uk/renewables/renew_atlaspages.htm |
| 3 | THAKE, J., DTI Renewables: Development, Installation and Testing of a Large Scale Tidal Current Turbine. [PDF] 2005 [cited 02 May 2006]; Available from http://www.dti.gov.uk/renewables/publications/pdfs/t060021rep.pdf |
| 4 | UK Hydrographic Office: Admiralty Charts & Publications. [Webpage] [cited 02 May 2006]; Available from http://www.ukho.gov.uk/ |
| 5 | GARRAD HASSAN & PARTNERS, et al., DTI: Uk Atlas of Offshore Renewable Energy. 2004 [cited 02 May 2006]; Government renewable energy policy; Available from http://www.dti.gov.uk/renewables/renew_atlaspages.htm |
| Tidal
Currents |
Go back to Contents