
 Home
Home 

| Case
Study Conclusions |
Part 1: Resource Process
1. IDENTIFY PROSPECTIVE SITE: Sound of Islay
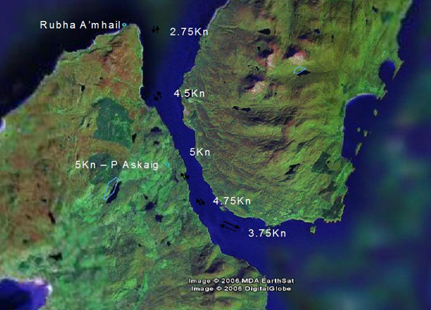
2. Use ADMIRALTY CHARTS to define:
|
 |
5. MAPPING
Generate cross section profile to scale in AutoCAD or similar |
 |
Export profile as a bitmap |
 |
Colour code surface roughness |
|
6. TIDAL DATA
- Using tidal spread sheet insert values for:
- Bathymetry roughness, blockage, meander, irregularity, etc
- Tidal heights over a period of interest for two diametric ports near to the site
- Fig: extracted values from easy tide
7. Tidal spreadsheet generates values for:
- Mean flow rate
- Optimum turbine energy capture
- Simultaneous calculation of Manning’s & Bernoulli nos. to yield friction coefficients if desired
8. VELOCITY DISTRIBUTION SOFTWARE
- Insert coloured bitmap profile into program
- Insert value for slope in stream direction
- Insert values generated from tidal spreadsheet
9. GENERATE VELOCITY DISTRIBUTION FOR SITE
back to top
Part 2: Technology Matching
10. Set a 30m depth limit and subtract inoperable areas from the profile:
- 5m from surface
- 5m from seabed

11. Using tidal data, generate a frequency distribution over a year of tidal current velocities
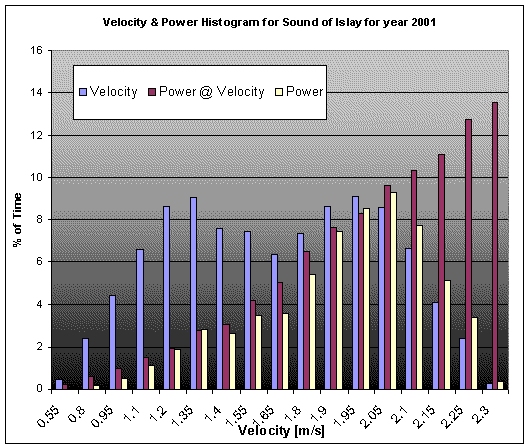
12. Find the predominant velocity for the channel profile: 2m/s (from velocity spectral density curve)
13. Find the Cp (efficiency) of each technology and size at the predominant velocity:
.gif)
14. To calculate the NUMBER of devices that fit into channel.
(This is a function of the area, depth, & number of devices
and is limited by the recommended extraction value (SIF))
- Set spacing distances as follows:
 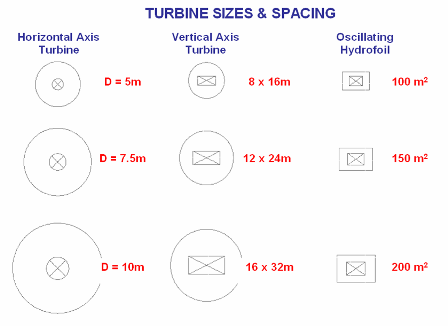 |
|
 |
|
15. LOCATE the devices in the appropriate areas of the velocity profile until space is exhausted
Fig: Three different sizes and spacing for each technology inserted into the available space in the profile
16. Calculate the SIF (Significant Impact Factor) with respect to the velocity
.gif)
- If SIF limit of 10% is exceeded, recalculate number of devices that can be inserted into channel
17. Calculate the total POWER output over the year using the number of devices, the inflow area, the Cp and the SIF impact on velocity and therefore generate 9 possible options in terms of size, number inserted & power output
16. Assess most suitable technology by considering power output in conjunction with economics & environmental impacts for a particular velocity profile
17. Repeat entire process by considering the power output for another profile the specified distance along the channel
18. Repeat by generating profiles and their potential power outputs along the channel and summing the value to calculate the power output for the entire length of channel
| Case
Study Conclusions |
Go back to Contents