
Menu:
Sizing Procedure
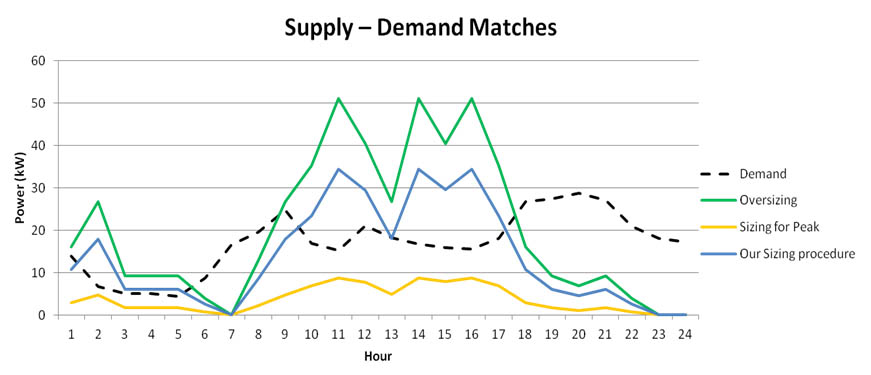
Choosing an appropriate renewables scheme size was crucial in our project. After doing extensive literature review, the group decided that it was necessary to develop a new hybrid sizing procedure, as the existing ones were not accurate enough for our purposes, as shown in the graph below:
The creation of the procedure is explained below:
The basis of our sizing technique is to divide the renewable supply technologies into small increments and then add them up in order to see which combination provides the best matching rate (see Supply-Demand for more information on the matching rate).
The sizing procedure involves 5 steps within the computational modelling tool, "Merit":
1. Demand data is imported.
2. Climate data is imported or selected.
3. Technologies are loaded in 15% increments.
Photovoltaic panels (PV) are simple to consider using this analysis. They can be entered into Merit according to how many Watts are required to make up 15% of the peak demand. They are added in arrays, for example; 15% of 160kW peak demand is 24kW, therefore 24kW worth of the PV to be installed and in this case 24 x 100W panels.
Wind is slightly more complex than PV in this sizing procedure. Initially the same method was used for wind turbines as has just been explained for PV, however, upon investigation we discovered that 10 1kW wind turbines do not produce the same power output as 1 10kW wind turbine. Therefore an approach which considers this was developed. For wind turbines, the modelling components must have 15% of the peak demand added to each step. For the example used to explain PV above, the increments in the simulation would be 24kW, 48kW, 72kW and so on.
4. Supply is sized: Once all of the necessary components are added to the model, each wind turbine is combined with one PV array, then two PV arrays and so on, until all PV options are combined with each turbine.
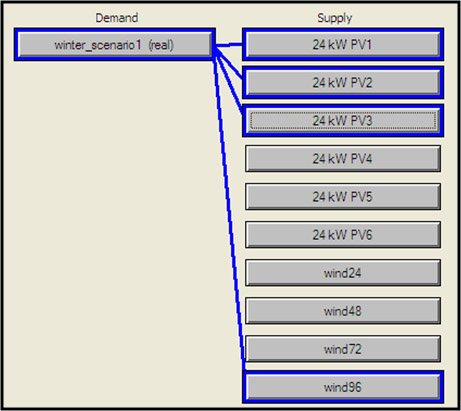
5. Results are exported: Once all possible combinations have been tested, the results are exported to a spreadsheet, where the best choice will be selected based on the highest match rate.
Key Findings
One major finding from the sizing procedure was that the smaller the peak demand to be sized, the larger the percentage of peak demand required to size it to a high match rate.
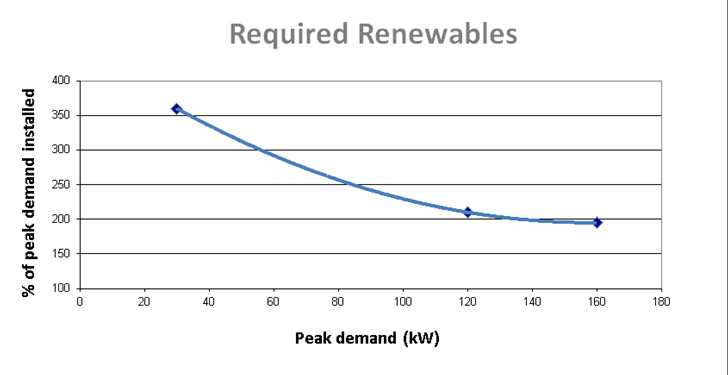
As we can see from this graph, a peak demand of 160kW required almost 200% of peak demand to be installed, a peak demand of 120kW required over 200% of peak demand to be installed and a peak demand of 30kW required over 350% of peak demand to be installed. This is a large increase and has obvious implications with the cost of such a comparatively large system.