
Menu:
Economic Impacts
The effect of Feed-In Tariffs on the investment return has been studied for the three scenarios (present, 2020 and 2050).
Assumptions
-Overall instalment cost:
PV: 40£/kWh
Wind: 1000£/kWh [1].
-Annual maintenance cost assumptions:
PV: 0% Capital Cost
Wind: 3% Capital Cost [2].
-Feed-In tariffs future evolution [3].
-Electricity cost: Until 2020, significant increase due to the renewables targets. From 2020 onwards, increase only due to the inflation (assumed 1.2% annual).
- The surplus of an installed renewables scheme will increase lineally. The progression equation has been obtained by means of simulation results.
- The deficit of an installed renewables scheme will decrease lineally. The progression equation has been obtained by means of simulation results.
- In 2050, the price (p/kWh) to sell electricity to the grid is the same as the buying one.
- The discount factor is assumed to be 8% per annum.
Calculations explanation
The economic study has been performed for 25 years period as this is the equipment lifetime period and the feed in tariff period assumed. The following example table shows the issues considered:
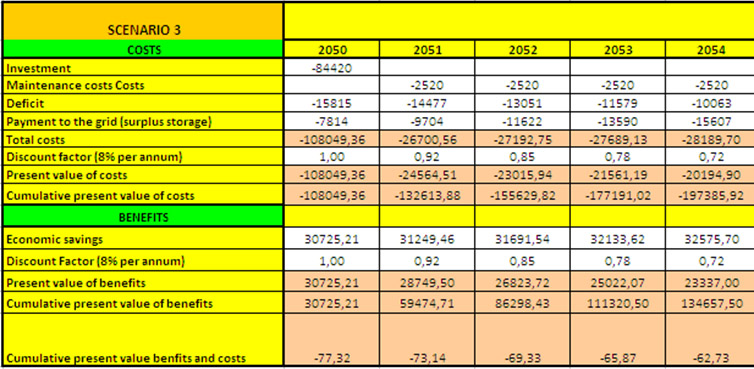
White cells (input)
Investment: Is the cost of the renewable devices.
Maintenance costs: Includes preventive maintenance as well as small repairs.
Deficit: Amount of money paid to the grid for the energy that cannot be produced by means of the renewable devices.
Payment to the grid (surplus storage): only applies to the 2050 scenario, in the case where it is assumed that the consumer has to pay to the grid to store their surplus.
Discount factor: Is a factor that when multiplied by an economic value in a future time, returns the present value of that amount.
Economic savings(own criterion): The profits made from the Feed in Tariffs (in the cases that apply) plus the economic equivalent of the produced energy by means of the renewable supply.
Pink cells (calculations)
Total costs: Sum of all the costs.
Present value of costs/benefits: Present time equivalent of future costs/benefits taking into consideration the “Discount factor”.
Cumulative present value of costs/benefits: Obtained adding the “Present value of costs/benefits” of the current year plus the “Cumulative present value of costs/benefits” of the previous year.
Cumulative present value of benefits and costs: Obtained adding “Cumulative present value of benefits” and “Cumulative present value of costs”.
Results
The following graph shows the expected return of the investment for present scenario (blue), 2020 scenario (red), 2050 scenario (green).
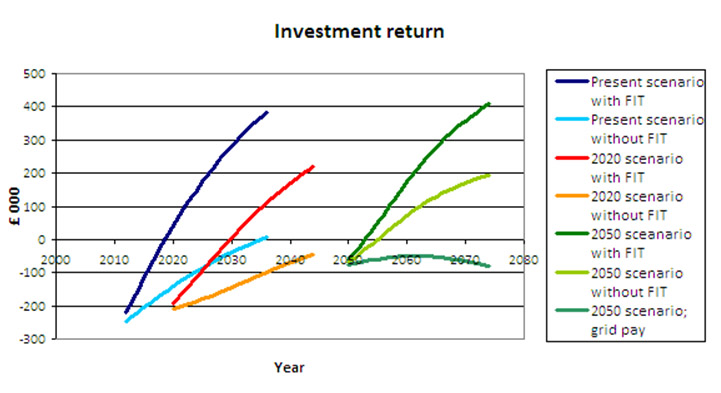
The figure clearly highlights the role of the incentives in encouraging investment.
For our Present scenario we can see that with feed-in-tariff, it is possible to achieve a profit and indeed gain more than the value of the investment. Without feed-in-tariff, it is possible to break even with the economic savings from producing electricity from renewables at least matching the cost of the initial investment over 25 years.
For the 2020 scenario we can see that with feed-in-tariff it is again possible to make a profit, although not as much as at present. Without feed-in-tariff the economic savings made do not match the original investment, and so the system would result in losses.
For the 2050 scenario we can see that both with and without feed-in-tariff results in an overall profit. This is mostly due to the increased price of electricity in the future, and the reduced cost in overall investment due to reducing demand in the future.
For 2050 it has also been considered the worst case in which consumers would have to pay to the grid for storing their energy surplus. In this case no money is made at all, and no benefits are gained from the investment.
The spreadsheet document used for this analysis is available for download.
References
[1] Scottish Government. Community Renewables Toolkit, (2011) Available at: http://www.scotland.gov.uk/Resource/Doc/917/0115761.pdf (accessed: 15/04/2012).
[2] D.B. Nelson, M.H.Nehrirr, C. Wang. Unit sizing and cost analysis of stand-alone hybrid wind/PV/fuel cell power generation systems, (2005) Available at: http://ac.els-cdn.com/ (accessed: 15/04/2012).
[3] OFGEM. FIT Payment Rate Table with Retail Price Index adjustments & Fast Track Review amendments. Available at:http://www.ofgem.gov.uk/Sustainability/Environment/fits/Documents1/Feed-in%20Tariff%20Table%201%20August%202011.pdf (accessed: 15/04/2012).