
SUPPLY
The supply of the District Heating Scheme is the Wind Surplus in the Island. Therefore, the first step is to obtain the profiles for this surplus.
As the demand supply conditions in the island are complex and cannot be measured in a specific value, we have created four different scenarios of supply-demand profiles, considering different demand conditions and wind capacities in the island.
All the specifications and the analysis undertaken to obtain the four scenarios of wind surplus are deeply explained in the Wind Surplus Section. Then, these surpluses have been introduced as thermal supply profiles in the software.
DEMAND
The demand profiles are specified in the software by defining all the individual buildings, introducing the calculated heating loads. Then, these profiles have been scaled with the purpose of including both the Distribution Network and the Thermal Store heat losses. To finish, the demands for the different buildings are added to create Scenario 1 (Papdale and Council) and Scenario 2 (including also White St and a future building).
AUXILIARY EQUIPMENT
The thermal store has been defined as auxiliary equipment whereby its characteristics are specified in order to match it with our thermal store selection. Initially, the volumes obtained from the hand calculations have been introduced, and with the purpose of undertaking a sensitivity analysis of the system, the simulations have been repeated with different Thermal Store Volumes.
SIMULATION RESULTS
The supply-demand thermal match gives the following results:
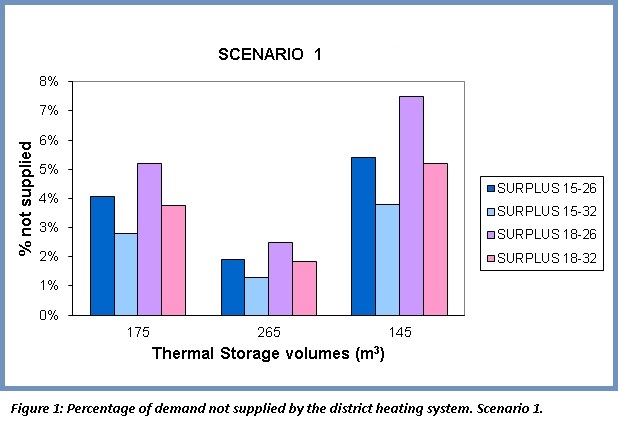
This graphic shows the percentage of energy deficit of the system, or in other words, the percentage that the district heating scheme is not able to supply for Scenario 1 for three different thermal store volumes.
The different columns represent the four different surplus conditions. Hence, there is a % of deficit per each surplus and thermal store volume. With the hand calculation's volumes the % of not supplied demand is really low, so this scheme would also work with a lower volume, considering that around 10% could be supplied by oil boilers.
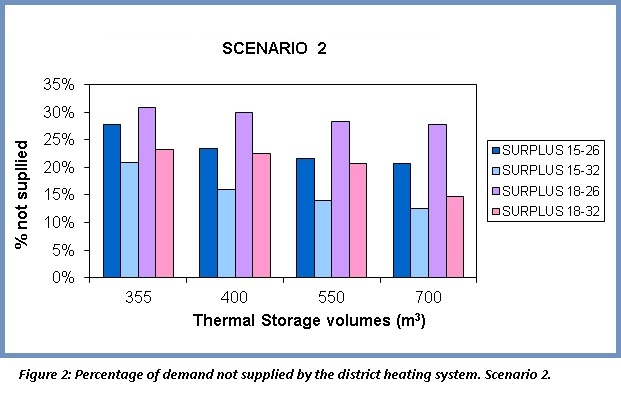
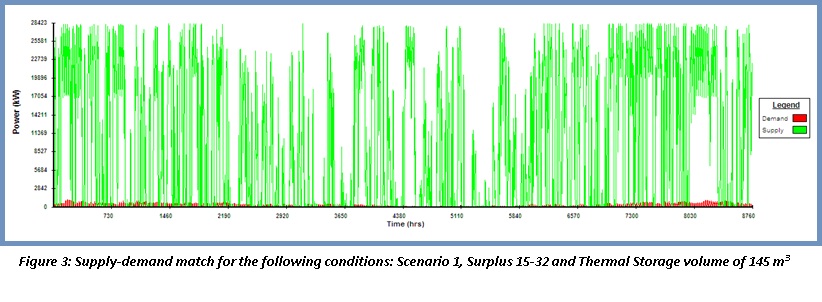
For Scenario 2, the percentage of not supplied demand has higher values, as the heat requirements are greater. It can be seen that the hand calculation volumes don't perform very well, so some simulations have been run with different volumes, in order to find a better choice. It can be seen that, when increasing the volume even to 700 m3, the % is not significantly reduced. This can be explained analysing Figure 3 which shows that the surplus is below the demand during some days along the year, so even a great thermal store cannot provide the demand requirements.
Therefore, in order to balance the district heating matching performance and the financial implications, a volume of 400 m3 has been selected as the best option for this scenario.
The supply-demand match graphic for the selected volume for Scenario 2 and the surplus scenario 15-32 is shown below, as an example of the representation obtained with the software.
POSIBLE IMPROVEMENTS AND SUGGESTIONS
In can been seen in scenario 2 that the performance of the thermal store in providing heating to the customer reliably suffers due to the increased heating load. However, it is possible to mitigate this downturn in performance with further negotiation with the energy company. In periods of little surplus wind energy perhaps the thermal store could be charged using normal grid supplied electricity.
This could increase the performance of the district heating network from providing only 72%-88% of the heating requirements (as seen above) to a percentage similar to that seen in scenario 1. However, it is likely that this electricity would come at an increased price than that of the surplus electricity. This will influence the financial projections and viability of the project so careful analysis and negotiations must take place between the energy company and the local council if this is to happen.