Two case studies have been created to investigate installing “micro-CHP” in the smaller 8-household tenement, and “mini-CHP” in the larger 80-houshold high-rise.
To produce an electrical consumption pattern for a typical day, we used “Standard European Profiles” normalised to match an average household size of 1.5. Based on GHA data, this number is obtained by assuming 75 % is occupied by 1 person and 25 % of the houses are occupied by 3 persons. This assumption also means that in the case study, 75 % of the houses are taken as low load profile and 25 % were taken as medium load profile houses.


On any given day, the baseload consumption is low throughout the day, with occasional peaks beyond 1kW –when the kettle or dishwasher was switched on. The following graphs show two typical days for a "medium" consumption profile (in this case a Tuesday and a Wednesday). For more graphs, please check out the case study spreadsheet in the downloads page.


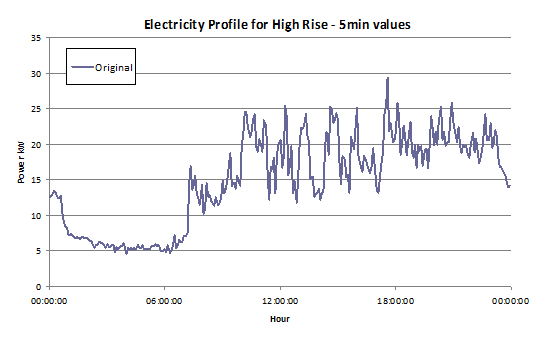
To model the electricity consumption of a high-rise, it is not valid to simply multiply this profile by the number of households in the building, as in reality the peaks would always occur at different times in each dwelling. A method has been employed of adding 80 different days from the Standard European Profile, which would result in the same random spacing of the peak loads. To simulate the electricity consumption patterns of each household, a daily profile has been assumed and repeated throughout the analysis year.

As seen in the graph there is clear smoothing out of loads in the overall consumption of the high-rise.
© University of Strathclyde 2009
![]()
