Cost Analysis
N.B: Some of the costs above were converted from US Dollars or Euros to GBP pound sterling. Uncertainties will arise due to the frequent fluctuations in currency values.
In the previous section (increasing capacity) it was shown that each scenario produced one configuration that was the most cost-effective. In this section, these four configurations are compared, taking into account the necessary expenditure in reaching the given scenario eg. upgrading buildings and installing GSHPs. Excel spreadsheets for all the sections below are available for download here.
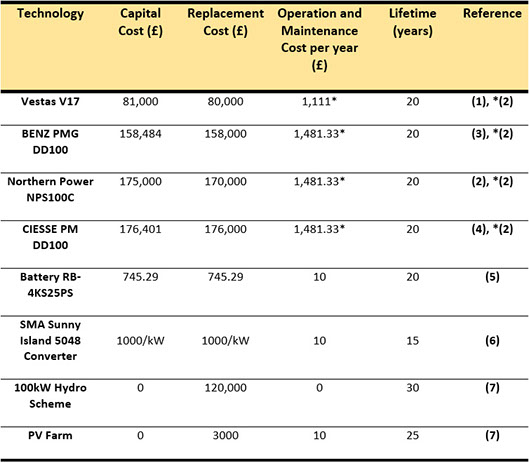
For reference, the table to the right provides all the costings that were input into HOMER along with lifetimes for the different pieces of equipment. The capital costs for the PV and hydro schemes were set to zero because they are already implemented on the island. Numbers in brackets refer to the references for the value in question which can be accessed here. In addition to the costs, an operational lifetime of 25 years with a discount rate of 8% and an inflation rate of 2% were chosen in order for HOMER to calculate a net present cost (NPC).
Is it financially even worthwhile upgrading the buildings on Eigg? Here, configurations for the upgraded and non-upgraded buildings are compared when installed with ASHPs then GSHPs. The calculation process for both the ‘100% electrification’ and ‘inclusion of biomass’ scenarios is the same and is shown below. The results of this cost analysis are displayed whilst a download of the full Excel spreadsheet used for the costs is downloadable on the useful links page.
Comparing Upgraded and Non-Upgraded Buildings
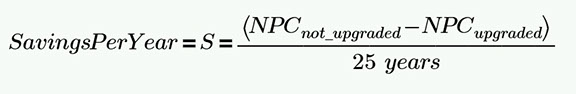
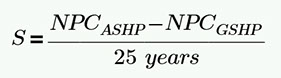
From the difference in NPC between the upgraded and non-upgraded scenarios, an average savings per year (from the 25 years of operation) can be calculated:
𝑆𝑎𝑣𝑖𝑛𝑔𝑠 𝑝𝑒𝑟 𝑌𝑒𝑎𝑟=𝑆=(𝑁𝑃𝐶(𝑛𝑜𝑡 𝑢𝑝𝑔𝑟𝑎𝑑𝑒𝑑)−𝑁𝑃𝐶 (𝑢𝑝𝑔𝑟𝑎𝑑𝑒𝑑))/(25 𝑦𝑒𝑎𝑟𝑠)
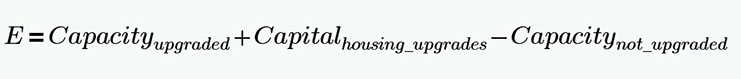
Next, the extra cost, E, required for having upgraded housing with ASHPs or GSHPs is calculated using simple arithmetic. The capital cost required for the increased capacity with upgraded buildings and with the non-upgraded buildings are denoted as 𝐶𝑎𝑝𝑎𝑐𝑖𝑡𝑦(𝑢𝑝𝑔𝑟𝑎𝑑𝑒𝑑) and 𝐶𝑎𝑝𝑎𝑐𝑖𝑡𝑦(𝑛𝑜𝑡 𝑢𝑝𝑔𝑟𝑎𝑑𝑒𝑑) respectively:
𝐸=𝐶𝑎𝑝𝑎𝑐𝑖𝑡𝑦(𝑢𝑝𝑔𝑟𝑎𝑑𝑒𝑑)+𝐶𝑎𝑝𝑖𝑡𝑎𝑙(ℎ𝑜𝑢𝑠𝑖𝑛𝑔 𝑢𝑝𝑔𝑟𝑎𝑑𝑒𝑠)−𝐶𝑎𝑝𝑎𝑐𝑖𝑡𝑦(𝑛𝑜𝑡 𝑢𝑝𝑔𝑟𝑎𝑑𝑒𝑑)
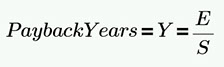
Finally, to see whether upgrading Eigg’s buildings is worthwhile, when installing ASHPs or GSHPs, a straightforward division is used. The result is the number of payback years ie. the number of years that would be required for the savings from the more expensive capital investment to break even with the cheaper option. The figure returned gives an indication of whether upgrading the buildings is a financially worthwhile exercise:
𝑃𝑎𝑦𝑏𝑎𝑐𝑘 𝑦𝑒𝑎𝑟𝑠=𝑌=𝐸/𝑆
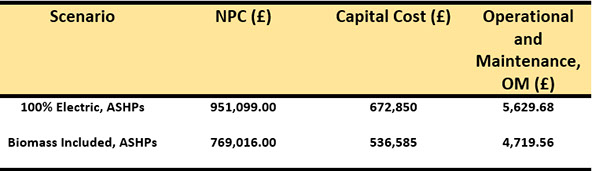
The results from the calculations are as follows:
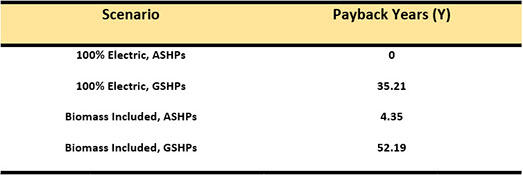
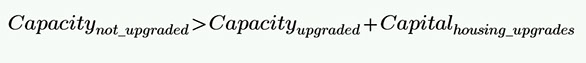
It is clear that if the decision were taken to install ASHPs then upgrading the buildings is certainly worthwhile. In the case of 100% electrification of heat via ASHPs, the total upgrade cost is actually less than that of the network with non-upgraded buildings ie.
𝐶𝑎𝑝𝑎𝑐𝑖𝑡𝑦(𝑛𝑜𝑡 𝑢𝑝𝑔𝑟𝑎𝑑𝑒𝑑) >𝐶𝑎𝑝𝑎𝑐𝑖𝑡𝑦(𝑢𝑝𝑔𝑟𝑎𝑑𝑒𝑑)+𝐶𝑎𝑝𝑖𝑡𝑎𝑙(𝑢𝑝𝑔𝑟𝑎𝑑𝑖𝑛𝑔 ℎ𝑜𝑢𝑠𝑖𝑛𝑔)
Comparing ASHPs and GSHPs
For the upgraded buildings, it must then be investigated as to whether ASHPs or GSHPs are more cost effective. Installing GSHPs will reduce the electrical load more so than ASHPs but then also cost more. The following step process was used to calculate the payback years on a GSHP investment:
This cost benefit analysis is for upgraded buildings and thus the cost of upgrading is omitted as it does not affect the comparison between the different heat pumps types. Therefore, the average savings per year using GSHPs compared to ASHPs is calculated as:
The extra capital cost incurred by installing GSHPs, E, is then calculated as:
𝐸=𝐶𝑎𝑝𝑎𝑐𝑖𝑡𝑦(𝐺𝑆𝐻𝑃)+𝐶𝑎𝑝𝑖𝑡𝑎𝑙(𝐺𝑆𝐻𝑃)−𝐶𝑎𝑝𝑎𝑐𝑖𝑡𝑦(𝐴𝑆𝐻𝑃)−𝐶𝑎𝑝𝑖𝑡𝑎𝑙(𝐴𝑆𝐻𝑃)
Where 𝐶𝑎𝑝𝑎𝑐𝑖𝑡𝑦(𝐺𝑆𝐻𝑃) is the cost of increasing the electrical network capacity when GSHPs have been installed. 𝐶𝑎𝑝𝑎𝑐𝑖𝑡𝑦(𝐴𝑆𝐻𝑃) is the corresponding cost but referring to installing ASHPs and 𝐶𝑎𝑝𝑖𝑡𝑎𝑙(𝐺𝑆𝐻𝑃) and 𝐶𝑎𝑝𝑖𝑡𝑎𝑙(𝐴𝑆𝐻𝑃) are the costs of the ground-source and air-source heat pumps respectively.
As with the previous section, the number of payback years, Y, can be easily calculated. This gives the number of years that would see a return on investment if choosing GSHPs over ASHPs:
𝑌= 𝐸/𝑆
It was found that:
For 100% Electrification: Y = 43.8 years
For heat pumps/biomass mix: Y = 107.53 years
These results indicate that if heating on the Isle of Eigg is to be provided, at least in part, by heat pumps then the best option is to upgrade buildings and install ASHPs.

ELECTRIFICATION WITH BIOMASS VS 100% ELECTRIFICATION of Heat
Before assessing the overall costs of these configurations, the true value of each system must be calculated. It is mentioned in the increased capacity section that the battery and converter costs must be adjusted to account for those already installed. The adjustment procedure is worked through in the Excel file "Costs" and can be downloaded here. The ‘new’ prices of batteries and converters are then put into HOMER and a new NPC and capital cost are calculated. The replacement and operational costs are left as previous.
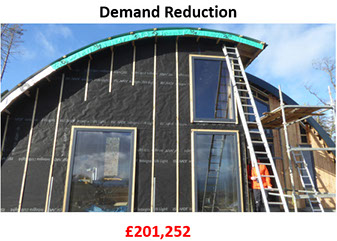
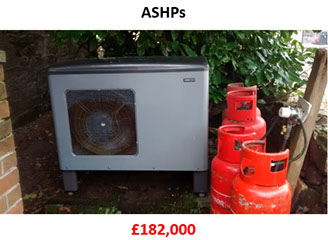
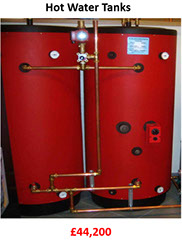
There are additional associated costs when considering the proposed solution to sustainable heating on Eigg. These are presented below for reference throughout the rest of this section. The costs for building upgrades, heat pumps and hot water systems are arrived at in demand reduction, heat pumps and hot water sections respectively.
NB: The OM costs displayed in the adjacent table refer only to those incurred by the components of the microgrid ie. biomass OM cost is not included. The OM cost for biomass is included in the final evaluation of the two options here.
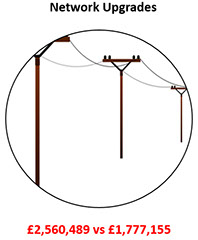
The network cost arises from the added cables and modification that comes with increasing the generation capacity. It also includes the costs of necessary construction eg. housing the extra batteries. The present microgrid was created with a capacity to include a 50% increase in order to encourage people to move to the island (8). In a conversation with Eigg Electric director John Booth (pictured opposite), the group were informed that half of this initial allowance had already been used up and that any further 25% increase would cost approximately £100,000. This information was used to calculate the increased network cost that would come about from the 100% electricity and the inclusion of biomass scenarios. Hence, two values are quoted for network upgrades with the former referring to the case of 100% electrification.

Consultation with John Booth, co-director of Eigg Electric, at his home in Galmisdale.
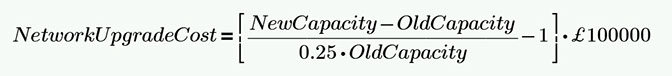
The increased network costs were calculated using the following equation for increased generation, battery storage and converters:
𝑁𝑒𝑡𝑤𝑜𝑟𝑘 𝑈𝑝𝑔𝑟𝑎𝑑𝑒 𝐶𝑜𝑠𝑡=[(𝑁𝑒𝑤 𝐶𝑎𝑝𝑎𝑐𝑖𝑡𝑦−𝑂𝑙𝑑 𝐶𝑎𝑝𝑎𝑐𝑖𝑡𝑦)/0.25(𝑂𝑙𝑑 𝐶𝑎𝑝𝑎𝑐𝑖𝑡𝑦) −1]
The ‘-1’ is included to account for the first 25% increase being effectively free on the basis of how the present network was initially set up. An Excel sheet including these calculations is available in the files ‘Costs with Biomass’ and ‘Costs without Biomass’, which can be downloaded here.
The total cost is simply the sum of the four contributions.
Cost Comparison
The cost of setting up a biomass infrastructure was calculated as £122,000 in the first year and then an operational and maintenance (OM) cost of £28,000 thereafter. Please visit the biomass page if interested in learning more about the biomass costs. The first year cost was used to calculate the total cost whilst the OM is used later for further analysis.
Total costs for purely electrifying heating on Eigg and for the option of including biomass were calculated:
100% ELECTRIFICATION = £3,660,791 ELECTRIFICATION WITH BIOMASS = £2,863,192
Incorporating biomass to take 20% of the heating demands, after upgrading the housing, is cheaper than supplying all heating via electricity by £797,599. However, the OM cost for running the electrical network is less than that for having a biomass industry. The total OM cost for including biomass will be that for the electrical network as well as for the running of the biomass industry. This amounts to £32,719.56, the vast majority of which is due to the biomass. The OM cost for 100% electrification, as given in the table of the above section is merely £5,629.68 by comparison.
The payback time for wholly supplying heating through electricity is given by the difference in total costs between the two options divided by the difference in OM costs. It is easily calculated as being 29.44 years. Therefore, including biomass still remains a more financially viable option when OM costs are taken account of.
Importantly, incorporating biomass means that heating is not entirely dependent upon one supply chain which increases the security of supply. This is especially important seeing as the electricity to supply heat is reliant on intermittent renewable sources.
© University of Strathclyde | TEC Eigg | Sustainable Engineering 2016