Fuel cell laboratory trial
Introduction
On 16th March 2016, two members of the group (Susan Brush and Lawson Otite) performed measurements in University of Strathclyde’s fuel cell laboratory.
The fuel cell consists of a stack of 63 individual electrochemical cells, connected in series, across which a voltage is generated when the cell is in operation. In addition, several auxiliary components (coolant pumps, fans, blowers, re-chargeable batteries) are part of the system: these components maintain stable operating conditions. The output power supply is fed via a converter to the load bank. Performance of various parameters can be observed in real time via an output screen on a PC: the full dataset of all parameters was collected during the trial. Trial description
After the first few minutes at no external load, the load on the fuel cell was increased to close to maximum output. After several minutes, the load was further increased right up to maximum, in two steps, with a few minutes between each change. After several minutes at maximum output, the output was reduced to 50% of rated output. Finally, the output was reduced to 25% of rated output.
- Stack output power (kW) i.e. from the stack of electrochemical cells - System output power (kW) i.e. after the power delivered to the external load, after some of the stack power is consumed by internal auxiliary components and the converter - Hydrogen consumption rate (Standard litres per minute) - Cell voltage (average, V) - “System efficiency” ( % , not defined in further detail in the fuel cell manual) Further parameters were derived from the downloaded data: - Hydrogen consumption rate (Normal litres / min) - Hydrogen consumption rate per unit power output (N litres/kWh) – for both system and stack power - “Stack efficiency by cell volts”: the ratio of actual (average) cell voltage to the thermoneutral voltage, taken to be 1.49V (The standard thermoneutral voltage, 1.48V, was corrected for non-standard pressure of hydrogen and oxygen, using the Nernst equation.) - Efficiency, of both stack and system, derived from the hydrogen consumption rate. (All efficiencies relative to enthalpy of oxidation of hydrogen, HHV.) Results
Voltage across the individual cells was displayed. There was a small spread of voltages, which varied slightly in real time. They were initially around 0.6 V. The aggregate voltage from the whole unit was 42 V. On increasing the load, the voltages all took a small dip, then gradually recovered over the next few minutes, to near but slightly below the original voltage. The same effect was observed when the voltage was increased again to rated output (5 kW). On reducing the load to 50 % of rated output (2.5 kW), the opposite effect was seen: voltages suddenly increased, then fell slightly over the next few minutes, settling on voltages higher than the previous ones. On reducing the load to 25 % of rated load, a similar effect was again observed. 2 - System and stack output power and voltage At all times, the “stack power”, “converter power” and “system power” had different values. The stack power was the highest; the converter roughly 10 % lower, and the “system power” slightly lower again. This was the case at all power outputs. 3 - Noise from auxiliary components There was significant noise from the auxiliary components when the fuel cell was being operated at or close to maximum output. The noise levels increased with power output, and decreased when output was reduced. 4 - Temperature of fuel cell It was observed that temperature within the cells varied little during the trial, stabilising at around 54°C.
Graph 1 (below): Rate of hydrogen consumption, and output power VS. Running time 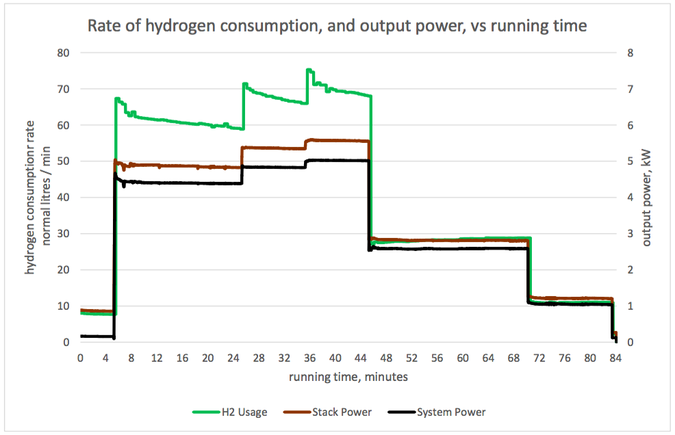
Graph 2 (below): Hydrogen consumption rate per unit electrical power, and output power VS. Running time 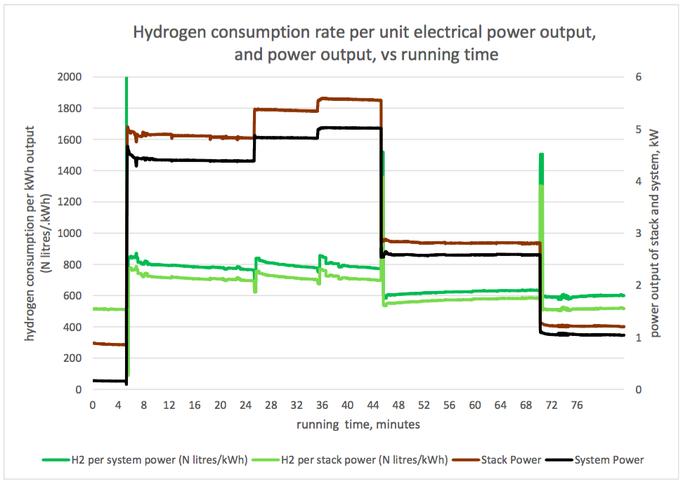
Graph 3 (below): Cell voltage and system efficiency VS. Running time 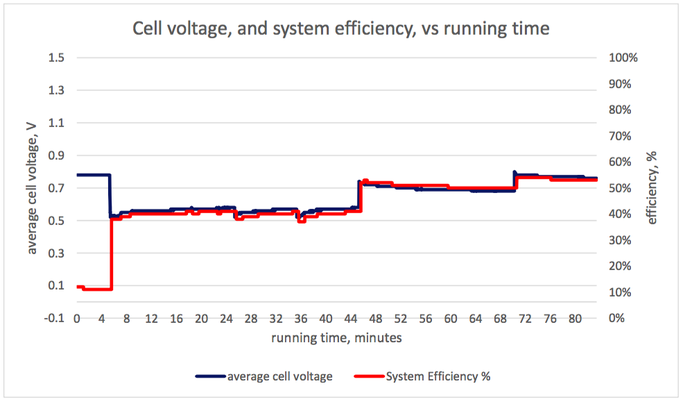
Graph 4 (below): Output power, and several measures of efficiency VS. Running time 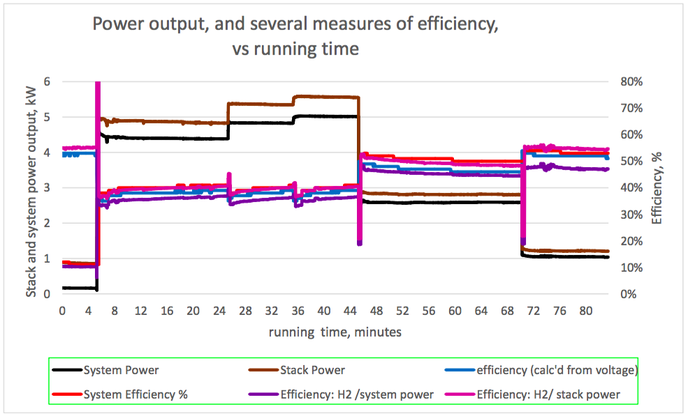
1. Hydrogen consumption rate The hydrogen consumption rate increased with load (graph 1, power output and hydrogen consumption rate vs running time). The consumption rate per unit power output was highest at high power outputs (graph 2). Consumption rates between 630 and 770 N litres/ kWh of system output were recorded, tabulated below. These would correspond to 630 and 770 Nm3/ MWh of output, in the system we model. To produce 6 MWh from a fuel cell of the same efficiency as this one, a hydrogen store of between 3800 and 4600 Nm3 would be needed, depending on the output power selected. 2. Cell voltage & Efficiency The cell voltage and the system efficiency followed each other very closely (after the first few minutes of no external load) as shown on graph 3. The top of the voltage axis, 1.5 V, is the thermo-neutral voltage, i.e. the voltage which a 100 % efficient fuel cell would generate. All measures of efficiency varied with load and were within the range 35-53 % (Graph 4). “Stack efficiency” was at all times higher than “system efficiency”, by approximately 10 %. The lowest voltages generated, and lowest efficiencies, were observed at full load. Efficiencies and voltages increased at lower loads. There were transient changes in voltages and efficiencies when the load was changed. These parameters settled over a period of several minutes. Here is the table giving the results from the fuel cell trial: 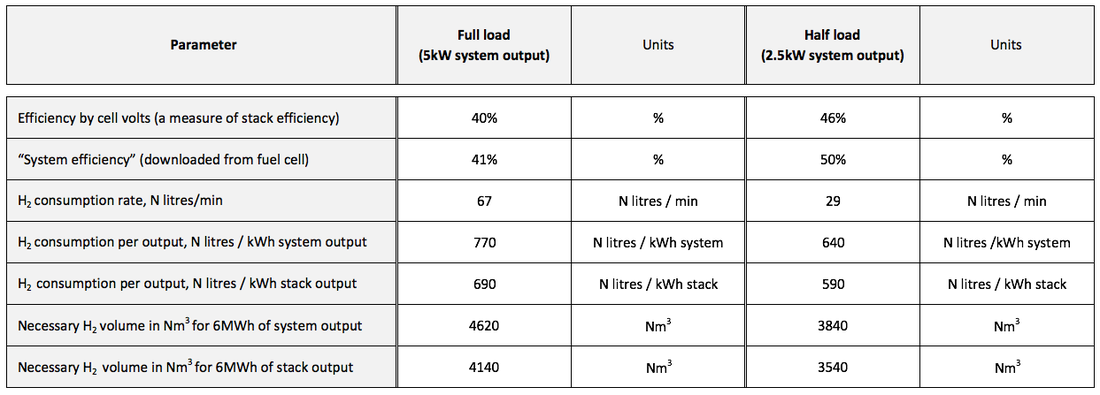
Limitation and applicability of results
It is prudent to view actual numerical results from this trial with some caution: the measurement period was brief, and results pertain to one single fuel cell, whose performance may differ from other fuel cells which are larger, newer or of different types.
However, these results are considered to give a good indication of general behaviour:
The wide set of parameters obtained from this trial, under different loading conditions, was extremely valuable. Conclusion
[1] US Department of Energy, Energy Efficiency & Renewable Energy, and Fuel Cell Technologies Programme. (2010). Fuel Cells.
Available: https://www1.eere.energy.gov/hydrogenandfuelcells/pdfs/fct_h2_fuelcell_factsheet.pdf [2] C. Spiegel, Designing and building fuel cells. New York: McGraw-Hill, 2007. [3] G. Hoogers, Fuel cell technology handbook. Boca Raton, Fla.: CRC Press, 2003. [4] T. Tsoutsos, Hybrid wind-energy systems. In: Stand-alone and hybrid wind energy systems : technology, energy storage and applications, ed. J.K. Kaldellis. Cambridge, UK : Boca Raton, Fla.: Woodhead Publishing Limited: CRC Press, 2010. [5] O. Ulleberg, T. Nakken, and A. Ete, "The wind/hydrogen demonstration system at Utsira in Norway: Evaluation of system performance using operational data and updated hydrogen energy system modeling tools," International Journal of Hydrogen Energy, vol. 35, pp. 1841-1852, 2010. [6] Siemens. (7 July 2015). World's largest hydrogen electrolysis facility. Available: http://www.siemens.com/innovation/en/home/pictures-of-the-future/energy-and-efficiency/smart-grids-and-energy-storage-largest-hydrogen-electrolysis-facility.html [7] Electric Light and Power. (16 May 2014). Siemens plans electrolyzer system to store wind power as hydrogen. Available: http://www.elp.com/articles/2014/05/siemens-plans-electrolyzer-system-to-store-wind-power-as-hydrogen.html |
H3P PROJECT - Modular Peak Power Plant
